
Infographics have become one of the most effective ways to present information in a visually appealing and easy-to-digest form. With the rise of the internet and social media, infographics have gained popularity among individuals and businesses alike. Whether you want to share data, educate your audience, or simply make your content more engaging, creating an infographic is a great way to achieve these goals.
But how do you go about creating an infographic? Well, it’s much easier than you might think! In this article, we will take you through the 5 steps of designing an infographic, from doing research to adding the final touches. By the end of this guide, you’ll have all the knowledge and tools you need to create your own visually stunning infographic.
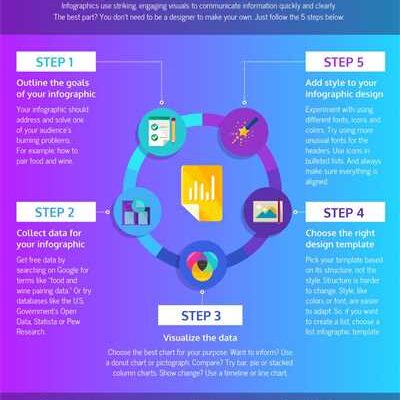
The first step in creating an infographic is to identify your main message or the information you want to convey. This is crucial as it sets the stage for the entire design process. You need to make sure that your infographic is focused and doesn’t overwhelm your audience with too much information. So, take some time to brainstorm and define the main points you want to highlight in your graphic.
Once you have a clear idea of what you want to communicate, it’s time to gather the data and sources that will support your message. This may involve conducting research, analyzing statistics, or collecting information from reliable sources. Remember to fact-check your data and make sure it’s accurate and up-to-date. Reliable sources like government websites, academic journals, and well-known research institutions are a good place to start.
Now that you have all the necessary information, it’s time to move on to the design stage. At this point, you can choose to create your infographic from scratch using a graphic design tool, or you can use ready-to-use templates and customize them. There are many online tools and software options available that offer easy-to-use interfaces and a wide range of design elements, colors, and visuals to choose from. Some popular infographic makers include Canva, Venngage, and Piktochart.
When designing your infographic, keep in mind that simplicity is key. Infographics are meant to present complex information in a visually appealing way, so avoid overcrowding your design with too many elements. Use colors, icons, and fonts that are cohesive and easy on the eyes. Make sure your visuals are aligned with your message and enhance the overall understanding of the information.
Finally, it’s time to make the finishing touches and get your infographic ready to share with the world. Review your design and make sure all the elements are in place. Check for any spelling or grammatical errors in your text. The final product should be visually striking, well-organized, and easy to understand. Once you’re happy with the result, save your infographic in a high-quality format, such as PNG or PDF, and share it on your website, blog, or social media platforms.
In conclusion, creating an infographic is a great way to communicate information in a more engaging and visually appealing way. By following these 5 easy steps, you can create a professional-looking infographic that is informative, easy to understand, and captures the attention of your target audience. So, don’t wait any longer – get started on your infographic journey and unlock the power of visual storytelling!
From Data to Design: How to Create an Infographic in 5 Easy Steps
Infographics have become one of the most popular and effective ways to present information in a visually digestible format. They make it easy to show complex data and research in a way that is easy to understand and much more engaging than just plain text. In this article, we will walk you through the process of creating an infographic, from gathering data to designing the final graphic.
- Gather Your Data
- Identify Your Key Points
- Design Your Infographic
- Create Visuals and Graphics
- Share and Promote
The first step in creating an infographic is to gather all the necessary data. This could be information from research, statistics, or any other relevant content that you want to present. Make sure to gather reliable and accurate data from credible sources.
Once you have gathered all the data, identify the key points that you want to highlight in your infographic. Think about what information is most important and relevant to your audience. This will help you create a clear and focused message.
Now it’s time to unleash your creativity and design the infographic. Use colors, fonts, and visuals that complement your data and make it more engaging. You can use ready-to-use templates or create your own design from scratch.
A good infographic should have visuals and graphics that help illustrate the information. You can use charts, graphs, icons, or any other visual elements that enhance the understanding of your data. Be creative and think about how to best represent your data visually.
Once your infographic is ready, make sure to share and promote it. You can publish it on your website or blog, share it on social media, or include it in your presentations. Infographics are highly shareable and can help generate more interest and engagement with your content.
Creating an infographic is a creative and thought-provoking process that requires a good understanding of your data and a knack for designing visually appealing content. With the right tools and knowledge, you can create great infographics that effectively communicate your message and capture the attention of your audience.
So, whether you are looking to present your research findings, share historical facts, or simply make your content more engaging, infographics are a powerful tool that can help you achieve your goals in an exciting and impactful way.
What is a Good Infographic
An infographic is a visual representation of information or data that is designed to be easily understood and shared. The goal of a good infographic is to present complex information in a simple and visually appealing way. It should help viewers quickly and easily grasp the main points and gain a better understanding of the subject matter.
There are several key elements that make a good infographic:
- Clear and concise: A good infographic should present information in a clear and concise manner. It should use simple language and avoid jargon or technical terms that may confuse the audience.
- Effective visuals: Visual elements such as charts, graphs, icons, and illustrations play a crucial role in infographic design. They help to organize and present information in a visually appealing way, making it easier for viewers to digest and understand.
- Strong design: A good infographic should have a visually pleasing design that captures the attention of the audience. It should use colors, fonts, and layout in a way that enhances the overall message and creates a cohesive and engaging visual experience.
- Accurate and credible: To create an effective infographic, it’s crucial to gather information from reliable sources and ensure its accuracy. The information should be properly cited, and any data used should come from reputable sources.
- Relevant and engaging: A good infographic should be relevant to the target audience and communicate information in a way that captures their interest. It should be designed with the audience in mind and address their needs and interests.
Creating a good infographic involves several stages. Firstly, you need to identify the main message or purpose of the infographic. This will help guide your research and content gathering process. Secondly, you need to organize the information into different groups or sections. This will help you create a logical flow and structure for your infographic.
Next, you can start designing your infographic using a variety of tools and software. There are numerous ready-to-use infographic makers available online that provide templates and design elements to choose from. However, it’s important to make sure that your infographic stands out and is unique.
Once you have designed your infographic, it’s important to review and revise it. Check for any errors or inconsistencies and make sure that everything looks cohesive and visually appealing. A good infographic should be able to convey the message and information effectively without relying too much on text.
Finally, you can share your infographic through various channels such as social media, websites, blogs, or presentations. This will help increase its reach and engage a wider audience.
In conclusion, a good infographic is a powerful tool for presenting information in a visually appealing and easily digestible way. It helps to engage viewers, communicate complex ideas, and make data more accessible. With careful thought and consideration in the designing process, a good infographic can effectively convey information and leave a lasting impression on the audience.
The history of infographics

Infographics have become a popular way to present information in a visually appealing and easily digestible format. But have you ever thought about where infographics came from and how they have evolved over the years? Let’s take a quick look at the history of infographics to better understand their development and significance.
Infographics have been around for centuries, with early examples dating back to the year 2500 BC. In ancient times, visual representations were used to convey information, such as cave drawings and hieroglyphics. These early forms of infographics were often used to share knowledge and tell stories.
Fast forward to the modern era, and infographics have become an essential tool in the communication of complex information. The rise of the internet and social media has opened up new possibilities for creating and sharing infographics, making them more accessible to a wider audience.
One of the most significant developments in the history of infographics was the introduction of the computer and graphic design software. This allowed designers to create visually stunning infographics with ease, using colors, shapes, and illustrations to enhance the content.
Today, there are many different ways to create infographics. From open-source tools to ready-to-use templates, the process has become much more accessible for both individuals and businesses. With the help of graphic design software and online infographic makers, anyone can now create their own infographics in just a few easy steps.
Infographics have also evolved to serve different purposes. While they were traditionally used to display research data and statistics, they are now used for a wide range of topics, including educational content, marketing materials, and social media posts. Infographics are a great way to quickly and effectively share information, engage with your audience, and make your content more memorable.
The key to creating effective infographics is to identify your target audience and tailor your design and content to their needs and preferences. By understanding what information they are seeking and how they like to consume it, you can create infographics that resonate and are more likely to be shared.
In conclusion, the history of infographics shows us that they have come a long way since their early beginnings. From simple cave drawings to intricate digital designs, infographics have proven to be a powerful tool for communication and knowledge sharing. Whether you are a business owner, marketer, or educator, infographics can help you convey complex ideas in a visually appealing and engaging way.
Get creative with our ready-to-use templates
Creating an infographic from scratch can be a challenging process. It requires a good understanding of design principles, knowledge of how to identify and present data in a visually appealing way, and the ability to effectively communicate information. But fear not, we have a solution for you!
Our infographic maker comes with a wide variety of ready-to-use templates that can help you quickly and easily create stunning visuals. Whether you need to show the history of a topic, guide your audience through a step-by-step process, or simply present information in a more digestible format, our templates have got you covered.
By using our templates, you can save time and effort by not having to design everything from scratch. The templates are already pre-designed with great graphics, colors, and layouts, so all you need to do is add your own content and make it your own. And with our easy-to-use tool, even those with little to no design knowledge can create professional-looking infographics.
Infographics are a great tool for making complex information more easily understandable. People are more likely to engage with and share infographics on social media than they are with plain text. Infographics can also help your audience quickly identify key points and take in information at a glance.
So make sure to get creative with our ready-to-use templates. They are a valuable resource that can help you create better, more effective infographics in less time. Open up our infographic maker and start exploring the different templates available. You’ll be amazed at how quickly you can create eye-catching visuals that not only look great but also communicate your message effectively.
Final Thoughts
Creating infographics can be a great way to present information in a visually appealing and easily digestible format. With the help of ready-to-use templates and design tools like an infographic maker, you can quickly and effectively make your content more engaging and informative.
When designing an infographic, it’s important to have a good understanding of the data and the message you want to convey. Research and gather all the necessary information to ensure that your infographics are accurate and credible. Make sure to cite your sources properly to give credit to the original creators of the data.
Infographics should not only look good, but they should also be effective in conveying the message. Use colors and different graphic elements to make your visuals stand out and attract the attention of your audience. Also, consider using a creative layout to make your infographics more unique and interesting.
Social media has played a significant role in the popularity of infographics over the years. People are more likely to share infographics on their social media platforms due to their visually appealing nature. This can help increase the reach of your infographics and make them more widely seen.
Throughout the infographic creation process, it’s important to go through several stages of understanding and clarification. From gathering information to designing and finalizing the infographic, each stage is crucial to ensuring the quality and effectiveness of your infographic.
Infographics are a powerful tool to help communicate complex information in a simple and visually appealing way. They allow viewers to quickly grasp the main points and key data without going through lengthy text documents or articles. By using infographics, you can engage your audience and make your information more memorable.
Infographics are not just limited to the internet; they have a long history and have been used in various fields to present data and information. From educational materials to advertisements, infographics have been proven to be a versatile and useful tool.
In conclusion, infographics are a valuable tool for creating visually appealing and informative content. By following the steps mentioned above and using the right tools and resources, you can create compelling and effective infographics that will captivate your audience and get your message across.
| Key Takeaways: |
|---|
| Infographics are a popular and effective way to present information. |
| Research and gather all the necessary information before creating your infographic. |
| Use colors, different graphic elements, and creative layouts to make your infographics visually appealing. |
| Take advantage of social media to increase the reach of your infographics. |
| Go through several stages of understanding and clarification during the infographic creation process. |
| Infographics are a powerful tool for communicating complex information in a visually appealing manner. |
| Infographics have a long history and have been used in various fields. |
Sources
When creating an infographic, it’s important to gather reliable sources of information. This will ensure that your infographic is accurate and credible. Here are some sources that can help you in the process:
1. Research: Conduct thorough research to gather the necessary data and information for your infographic. Look for reputable sources such as scientific journals, industry reports, and trusted websites.
2. Text and Graphics: Identify the key messages you want to convey and find appropriate text and graphics to support them. Use clear and concise language to make your infographic easy to understand.
3. Templates and Ready-to-Use Graphics: Many online tools offer ready-to-use infographic templates and graphics, making it easier for you to create visually appealing infographics. Platforms like Canva, Venngage, and Piktochart have a wide range of templates and graphics to choose from.
4. Open Data: Open data sources provide access to a vast amount of information that can be used in infographics. Websites like Data.gov, World Bank Open Data, and Kaggle offer datasets on various topics.
5. History and Background: Understanding the history and background of a topic can add depth to your infographic. Research the subject thoroughly to provide a comprehensive view to your audience.
By using these sources, you can create a well-researched and visually appealing infographic that effectively communicates your message. Remember to always cite your sources and give credit where it’s due.