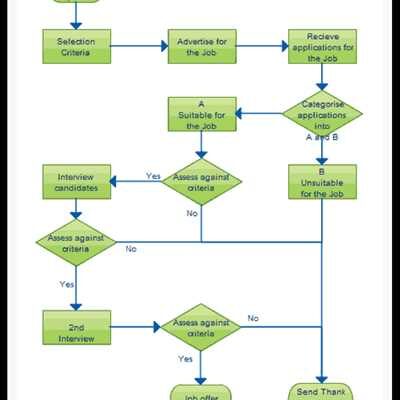

A system flowchart is a visual representation of the steps involved in a business process. It helps to understand how data flows through different processes and identify the main steps and decision points within the system. Flowcharts are effectively used to model and provide a unique description of a system’s workflow.
When creating a system flowchart, it is important to choose the right symbols and notation. There are different standards and symbols available, such as BPMN (Business Process Model and Notation) or MindManager, to help you effectively communicate your ideas. These symbols include rectangles to represent processes, diamonds to represent decision points, and flowlines to show the flow of data between steps.
One of the main steps in creating a system flowchart is identifying the main sources of data input and output. This can be done by using the standard symbols to map out each step in the process. Each step or process should be marked with a unique symbol to make it easier to understand the flowchart.
Another important aspect to consider when creating a system flowchart is to keep the flowchart simple and easy to follow. Use a clear and logical sequence of steps and ensure that the flowchart is not too complex. Use open-ended questions or FAQs to help guide the user through the flowchart and provide additional information if needed.
By following these steps and using the right symbols and notation, you can create a clear and effective system flowchart that helps to identify and understand the main processes and decision points within your business. Flowcharts are a valuable tool that can help businesses improve their systems and processes, and ensure that data flows smoothly and efficiently.
What is a Process Flowchart and How to Use it
A process flowchart is a visual representation of the steps or activities that make up a process or workflow. It helps in understanding the sequence of events or actions required to complete a task or achieve a goal. A process flowchart can provide a clear and concise overview of a system, making it easier to identify areas where improvements can be made and bottlenecks can be eliminated.
Flowcharts use different symbols to represent each step or decision within a process. The most common symbols used in process flowcharts include:
- Rectangle: Represents a step or activity
- Diamond: Represents a decision point
- Circle: Represents a terminator or end point
- Flowline: Connects the symbols and represents the flow of the process
By using these symbols, you can create a visual map of your business processes or workflows. A well-designed flowchart should be easy to follow and understand, even for someone who is unfamiliar with the process.
When creating a process flowchart, it is important to keep the following in mind:
- Start with a clear goal or objective in mind. What do you want to achieve with your flowchart?
- Identify the main steps or activities that need to be completed to achieve the goal and represent them using the appropriate symbols.
- Ensure that the flowchart is easy to understand and follow by using proper notation and standards. This will help users interpret the flowchart correctly.
- Provide a brief description or step-by-step explanation of each symbol and its meaning. This will help users understand the flowchart more effectively.
- Use different types of flowcharts, such as BPMN or mind maps, depending on your needs and the complexity of the process being mapped.
Process flowcharts can be helpful in many different contexts. They can be used to model and understand complex systems, map out business processes, provide a visual representation of data or user interactions, and even help in decision-making.
By using process flowcharts effectively, you can improve your understanding of a system or workflow, identify areas for improvement, and make informed decisions based on the information provided by the flowchart.
So, the next time you need to map out a process or workflow, consider using a process flowchart to help you visualize and understand the steps involved. It can be a valuable tool in streamlining your processes, improving efficiency, and achieving your desired outcomes.
Flowchart symbols
Flowcharts are a visual representation of processes or workflows, and they use symbols to represent different steps, decisions, and data flows within a system. By using flowchart symbols, it becomes easier to understand and effectively communicate how a system or process works. There are several types of flowchart symbols commonly used, and each symbol has a unique meaning and use.
Here are some common flowchart symbols:
| Symbol | Description |
|---|---|
| Terminator | The terminator symbol represents the start or end of a process. It is usually represented by a rectangle with rounded corners. |
| Process | The process symbol represents a step or action in the workflow. It is usually represented by a rectangle. |
| Decision | The decision symbol represents a decision point in the flowchart. It is usually represented by a diamond shape, with arrows indicating the different possible paths. |
| Data | The data symbol represents data input or output in the flowchart. It is usually represented by a parallelogram. |
| Flowline | The flowline symbol represents the flow or direction of the process. It is usually represented by an arrow connecting two symbols. |
When creating flowcharts, it is important to choose the symbols that best represent the processes or workflows within your business or system. The symbols used should provide a clear and concise understanding of what each step represents and how it flows through the system.
There are different types of flowchart notations that can be used, such as BPMN (Business Process Model and Notation) or MindManager, which have their own set of symbols and standards. It is important to choose a notation that best suits your needs and use it consistently throughout your flowcharts.
By using flowchart symbols effectively, you can create clear and understandable visual representations of your business processes or system workflows. This can help with identifying areas for improvement, modeling new processes, or documenting existing ones. With the right flowchart symbols and notation, you can effectively communicate how your system or process works.
Keep in mind that flowchart symbols are only a means to visually represent processes. The actual success of your workflow or response to an identified problem will depend on how effectively you implement the processes and systems within your organization.
FAQ What are the 4 Main Flowchart Types
When it comes to flowcharting, there are four main types of flowcharts that you can choose from, each with their own unique symbols and notation standards, to effectively represent different systems and processes. Understanding these types will help you identify which flowchart type is best suited for your needs.
1. Process Flowchart
A process flowchart is the most commonly used type of flowchart. It represents a step-by-step sequence of actions or decisions within a system. The process flowchart uses different symbols, such as a rectangle to represent a step/idea, a diamond to represent a decision, and an arrow or flowline to connect the steps or processes.
2. Workflow Diagram
A workflow diagram is a flowchart that represents the steps and processes within a specific workflow. It is used to provide a visual representation of how a business or data flows from one step to another. The workflow diagram uses unique symbols and notation standards to effectively represent the flow of work within a system.
3. Data Flow Diagram
A data flow diagram (DFD) is a flowchart that represents the flow of data through a system. It is used to identify and understand how data moves between different processes in a system. The DFD uses symbols and notation standards to effectively represent the flow of data within a system.
4. BPMN Diagram
The BPMN (Business Process Model and Notation) diagram is a flowchart that provides a standardized graphical notation for modelling business processes. It uses different symbols and notation standards to represent various elements of a business process, such as events, activities, gateways, and flows. The BPMN diagram helps to visually represent and understand complex business processes.
Each of these flowchart types has its own specific use and provides a description of a system or process in a unique way. By choosing the right flowchart type and using the appropriate symbols and notation, you can effectively represent and understand the flow within your system or process.
1 Process Flowchart
A process flowchart, also known as a process flow chart, represents the step-by-step flow of a system or business process. It is a visual representation that helps to understand how data, information, and decisions flow through a system. Flowcharts use unique symbols to provide a clear description of each step and help users to choose the best course of action.
There are several types of flowchart notation, but one of the most commonly used is the standard flowchart notation. This notation uses different symbols, such as rectangles, diamonds, and diverging flowlines, to represent different types of processes and decisions within a system.
When creating a process flowchart, it is important to follow the standards and guidelines of your organization or the industry. This includes identifying the main processes, understanding the flow of information, and marking any decision points or response requirements. By using these standards, you can effectively model and communicate how a system or workflow needs to function.
One popular tool for creating process flowcharts is MindManager. With MindManager, you can open a blank canvas and start mapping out your flowchart. The tool provides a variety of symbols and templates to choose from, making it easy to create a unique and visually appealing flowchart.
In addition to MindManager, there are many other software and online tools available for creating process flowcharts, such as BPMN (Business Process Model and Notation) tools. These tools offer more advanced features and capabilities for modeling complex processes.
Overall, the process flowchart is a valuable tool for understanding and documenting how a system or business process functions. It helps to visualize the flow of information, identify bottlenecks or inefficient processes, and provide a clear overview of how different steps and decisions are interconnected within the system.
2 Workflow Chart

When it comes to modelling the flow of a system or a process, flowcharts are an important tool to use. They provide a unique way to visualize and understand how different processes within a system flow and interact with each other. A workflow chart is one type of flowchart that helps to identify the steps and decision points within a process.
Workflow charts use various symbols to represent different types of processes and actions. One commonly used symbol is the rectangle, which represents a process or a step in the workflow. Another symbol that is often used is the diamond, which represents a decision point where the flow of the system diverges based on certain conditions or criteria. A rounded rectangle represents a terminator or an end point of the flow.
When creating a workflow chart, it is important to choose a notation and set of symbols that are in line with the standards used by your business or the system you are modelling. This will help to provide a clear and standardized representation of the workflow.
Here is a step-by-step guide on how to create a workflow chart:
- Start by identifying the main processes and decision points within the system or process you are modelling.
- Choose a flowchart notation and symbols that best represent the processes and decision points.
- Use the symbols to create a flowline that connects the processes and decision points in the order they occur.
- Mark any diverging flows with a diamond symbol and provide a description of the criteria or conditions that determine the flow.
- Open the flowchart with a start symbol and close it with an end symbol to indicate the beginning and end of the workflow.
By following these steps and using the appropriate symbols and notation, you can effectively create a workflow chart that helps to visualize and understand the flow of a system or a process. This can be helpful in identifying areas for improvement, understanding data flow within the system, and providing a visual aid for user training or documentation.
3 Data Flowchart
When it comes to designing a system flowchart, it is important to understand the different types of flowcharts and choose the one that best suits your needs. One unique type of flowchart is the data flowchart, which is used to visually represent how data flows through a system.
Data flowcharts use specific symbols to represent the various processes, sources, and destinations of data. One such symbol is the process symbol, which is often represented by a rectangle. This symbol is used to describe a specific step or activity within the system.
Another important symbol in data flowcharts is the terminator symbol, which is represented by an open rectangle. This symbol is used to mark the beginning and end of a process or workflow.
In addition to these symbols, data flowcharts also use flowlines to show the flow of data from one process to another. These flowlines are marked with arrows to indicate the direction of the data flow.
One thing to keep in mind when creating a data flowchart is that it should be easily understandable to all users. To help with this, it is recommended to use clear and concise descriptions for each step or process within the flowchart.
There are various software tools available that can help you create data flowcharts, such as Microsoft Visio, Lucidchart, or MindManager. These tools provide pre-defined symbols and templates that can be used to create effective data flowcharts.
When identifying the main processes within your system, it is important to consider what data needs to be captured, how it will be processed, and what the response will be. By effectively modelling your system with data flowcharts, you can better understand how data flows through your system and identify any potential issues or areas for improvement.
In conclusion, data flowcharts are a unique and important tool for understanding the flow of data within a system. By using the correct symbols, choosing the right notation, and providing clear descriptions, you can effectively represent the flow of data and workflows within your business processes.
4 Business Process Modelling Notation BPMN
Business Process Modelling Notation (BPMN) is a unique notation system that helps with the understanding and modelling of business processes. It provides a set of symbols and standards that are used to represent different types of activities, data flows, and decision points within a workflow.
When creating a BPMN flowchart, it is important to choose the right symbols and understand their meaning. Here are the main symbols used in BPMN:
1. Start/End events: These symbols represent the beginning and end of a process.
2. Process: This rectangle symbol represents a step or activity within the process.
3. Data flow: This symbol is used to show the movement of data from one system or step to another.
4. Decision: The diamond-shaped symbol is used to indicate decision points within the process, where different paths can be taken based on certain criteria.
5. Flowline: These lines connect the symbols and show the sequence in which activities are performed.
BPMN flowcharts can be created using various software tools such as MindManager, as well as through open-source systems. They can also be used to provide a visual representation of a business process, helping users to understand how different steps are interconnected and what needs to be done at each step.
By using BPMN, businesses can effectively identify and map out their workflow, making it easier to analyze and improve their processes. This can help to improve efficiency, reduce errors, and provide a better overall experience for both employees and customers.
If you have any further questions about BPMN or how to create a system flowchart, please check out our FAQ page.
Sources
When creating a system flowchart, it is important to understand the different sources that can help you effectively model your workflow. Here are some sources and tools that can assist you in creating a flowchart:
| 1. BPMN (Business Process Model and Notation) BPMN is a standard notation that represents the processes and workflow within a business system. It provides a unique set of symbols and types for identifying and understanding different steps in a process. |
| 2. Flowchart symbols Flowcharts use specific symbols to represent different processes, decisions, and data flow within a system. These symbols help to visually describe the steps and logic of a process. |
| 3. Flowchart software/tools There are various software and online tools available that can help you create flowcharts. Some popular options include Microsoft Visio, Lucidchart, and MindManager. These tools provide a user-friendly interface and features to easily create and edit flowcharts. |
| 4. Open-source software Open-source software options, such as draw.io and Dia, offer free and customizable options for creating flowcharts. These tools are often community-driven and provide a wide range of features and functionalities. |
| 5. User manuals, FAQs, and online resources When starting a flowchart, it is important to have a clear understanding of the process or system you are modeling. User manuals, FAQs, and online resources for the specific system can provide valuable information and insights to guide your flowchart creation. |
By utilizing these sources and tools, you can create an organized and comprehensive flowchart that effectively represents the workflow and processes of your system.