Flowcharts are a common format used by many organizations to represent their business processes and workflows. Microsoft Excel is a versatile software that can be used to create flowcharts with ease. In this article, we will guide you through the steps of creating flowcharts in Excel, a quick and easy way to visualize and understand complex processes.
The first step in creating a flowchart in Excel is to open a new worksheet and select the specific cells where you want the flowchart to appear. You can also create a new sheet titled “Flowchart” or use an existing sheet in your workbook. This will be the part of your Excel file where you will be drawing the flowchart.
Once you have set up your worksheet, you can start drawing the flowchart elements. Excel provides a variety of shapes and symbols that you can use, such as rectangles, circles, diamonds, and arrows. To access these shapes, go to the “Insert” tab, click on “Shapes”, and select the desired shape from the dropdown menu. You can then click and drag on the worksheet to draw the shape.
The next step is to connect the shapes to create a flow. To do this, click on the initial shape and then drag the connector to the next shape. Repeat this process for each stage of your flowchart. You can also customize the appearance of the shapes by formatting the colors, borders, and texts to make your flowchart easier to understand.
Excel also provides a grid system that you can use to align your shapes and create a more organized flowchart. To enable the grid, go to the “View” tab, click on “Gridlines”, and select “Show”. This will display a grid on your worksheet that you can use as a guide when drawing your flowchart.
Once you have finished creating your flowchart, you may want to link it to other parts of your Excel file or add images for further clarification. To link your flowchart, select the shape that you want to link and click on “Insert Hyperlink” in the right-click menu. You can then choose the location or cell in your Excel file that you want to link to.
Creating flowcharts in Excel is a useful skill to have, as it allows you to visualize and communicate complex processes in a simple and organized manner. Whether you are using Excel for personal or professional purposes, learning how to flowchart in Excel can help you streamline your workflows and improve your efficiency.
- Setting Up a Flowchart Drawing Grid in Excel
- What is a Flow Chart in Excel
- Common Elements and their uses in Flow Chart
- Part 2 How to Create a Flowchart in Excel Microsoft WPS
- 21How to Create a Flowchart in Microsoft Excel
- How to Create a Flowchart in WPS Excel
- Creating Flowchart in Excel
- Step 1
- Step 2
- Step 3
- Video:
- How to make Flow Chart in Excel | Automatic Flow Chart in Excel | Create Process Flow Chart in Excel
Setting Up a Flowchart Drawing Grid in Excel
If you need to create flowcharts or diagrams in Microsoft Excel, setting up a flowchart drawing grid can make the process much easier. By customizing the grid in Excel, you can easily align and connect the different shapes and elements of your flowchart.
Here’s how to set up a flowchart drawing grid in Excel:
- Open Excel and select the worksheet where you want to create your flowchart.
- Click on the “Page Layout” tab in the Excel ribbon at the top of the window.
- In the “Page Setup” section, click on the “Gridlines” button.
- A drop-down menu will appear. Select the “More Gridlines Options” at the bottom.
- In the Format Picture pane that appears on the right side of the Excel window, click on the “Picture” tab.
- Under the “Size and Properties” section, you can customize the grid settings to fit your needs.
- In the “Grid settings” section, you can adjust the spacing and proportions of the gridlines.
- You can also change the colors and line styles of the gridlines.
- Once you have customized the grid settings, click on the “Close” button to apply the changes.
Now, you will have a flowchart drawing grid set up in Excel, making it easier to create your flowcharts and diagrams. The gridlines will appear as straight lines on your Excel sheet, helping you align the different shapes and elements of your flowchart.
Remember that you can also use other formatting options in Excel to further customize your flowchart. For example, you can add colors and styles to the shapes and connectors used in your flowchart, making it visually appealing and easy to understand.
Creating flowcharts in Excel can be a quick and efficient way to visualize processes, system flows, and other common uses. By following these steps, you can easily set up and customize a flowchart drawing grid in Excel, giving you the flexibility to create professional-looking flowcharts with ease.
What is a Flow Chart in Excel
A flow chart is a visual representation of a process or workflow in Excel. It allows you to easily understand and visualize how different steps in a process are connected and flow together. Flow charts are commonly used in project management, process improvement, and decision-making.
In Excel, flow charts are created using the drawing tools available in the program. You can use shapes, lines, and arrows to represent different elements in the flow chart, such as tasks, decisions, inputs, outputs, and more.
To create a flow chart in Excel, you will need to follow these steps:
- Open Microsoft Excel and select a worksheet where you want the flow chart to appear.
- Click on the “Insert” tab in the Excel ribbon menu, and then click on “Shapes“.
- In the shapes menu, select the shape you want to use for the first step of your flow chart. Common flow chart shapes include rectangles, ovals, diamonds (decisions), and parallelograms (inputs/outputs).
- Click and drag on the worksheet to draw the shape. Position it accordingly.
- Repeat steps 3 and 4 to draw other shapes for the different stages or steps in your flow chart.
- To connect the shapes, click on the “Insert” tab and then click on “Shapes” again. Select the “Line” option.
- Click and drag from one shape to another to draw a line connecting them.
- If you want to customize the appearance of the flow chart, you can change the shape formatting, line color, font style, and more using the formatting options available in Excel.
- If you want to add text to the shapes, simply double-click on a shape and start typing.
- You can also insert images or other objects into the flow chart by clicking on the “Insert” tab and then selecting the appropriate option (e.g., “Picture“, “Clip Art“).
- Once you have finished creating the flow chart, you can save and share it like any other Excel worksheet.
Flow charts in Excel can be used for a variety of purposes, from documenting business processes to illustrating decision-making logic. They make it easier to understand complex systems or workflows by breaking them down into simple, visual steps. By creating a flow chart in Excel, you can effectively communicate your ideas and plans to others in a clear and concise manner.
Common Elements and their uses in Flow Chart
In order to create a flowchart in Microsoft Excel, there are a few common elements and their uses that you need to learn. These elements make it quick and easy to draw flowcharts in Excel, providing a visual representation of a process or system.
The first step is to open a new worksheet in Excel, or select the sheet where you want the flowchart to appear. You can also customize the sheet by setting a special grid layout or formatting.
Once the sheet is set up, you can start creating the flowchart. The most commonly used shapes in a flowchart are rectangles, diamonds, and parallelograms. Each shape represents a different step or stage in the process.
To create the flowchart, you can simply click on the “Insert” tab in the Excel Ribbon, then select “Shapes” in the Illustrations group. From there, you can choose the shape you want to use and drag it onto the worksheet to place it.
To connect the shapes and show the flow of the process, you can use lines or arrows. Simply click on the “Insert” tab, select “Shapes”, and choose the line or arrow shape. Then, click on the starting shape and drag the line or arrow to the next shape in the flow.
If you need to add additional flows or steps to the flowchart, you can repeat this process. Just select the shape you want to connect to and drag a line or arrow from it. You can also customize the appearance of the shapes and lines by selecting them and using the formatting options in the Excel Ribbon.
There is also a special flowchart tool available in Excel called “SmartArt”. To access it, click on the “Insert” tab, then select “SmartArt” in the Illustrations group. This tool provides pre-designed flowchart templates that can be customized with your own text and images.
In addition to Microsoft Excel, there are other software tools like WPS Office that can be used to draw flowcharts. The general process of creating a flowchart is similar in these programs, so the steps and elements mentioned above can be applied accordingly.
Overall, by learning these common elements and their uses, you can easily create flowcharts in Excel or other software programs. Flowcharts provide a clear and visual way to depict a process or system, making it easier for others to understand and follow.
Part 2 How to Create a Flowchart in Excel Microsoft WPS
In the previous part, we learned the basic steps in creating a flowchart in Excel. In this part, we will explore more advanced features and techniques to customize your flowchart.
Step 1: Open Microsoft Excel or WPS Office and create a new worksheet. This will be the canvas where you will draw your flowchart.
Step 2: In the worksheet, click on the “Insert” tab in the top menu bar. Then click on the “Shapes” button in the “Illustrations” group.
Step 3: A drop-down menu will appear with various shapes that you can use in your flowchart. Select the shape that corresponds to the first element of your flow, for example, a rectangle for a process or a diamond for a decision.
Step 4: Once you have selected the shape, move your cursor to the spot on the worksheet where you want the shape to appear. Click and drag the cursor to draw the shape. You can use the gridlines to align your shapes.
Step 5: Repeat steps 3 and 4 to add more shapes to your flowchart. Connect the shapes together by clicking on the small circles that appear on the edges of the shapes and dragging a line to another shape.
Step 6: You can also customize the appearance of the shapes by right-clicking on a shape and selecting “Format Shape” from the context menu. Here, you can change the color, size, and other formatting options.
Step 7: To add text to your shapes, select the shape and start typing. The text will appear inside the shape. You can also adjust the font style and size using the formatting options in the top menu bar.
Step 8: If you want to add a special symbol or image to your flowchart, click on the “Insert” tab again and select the appropriate option, such as “Pictures” or “Symbols”.
Step 9: As you create your flowchart, remember to label each shape with a meaningful name or description. This will make it easier for others to understand your flowchart.
Step 10: Once you have finished creating your flowchart, save the Excel or WPS file. You can also export it as an image or print it directly from the program.
By following these steps, you can create a flowchart in Excel or WPS Office to visualize and communicate different processes or workflows. Flowcharts are a common tool used in business, education, and other fields to represent complex systems and simplify understanding.
Now that you have learned how to create a flowchart in Excel or WPS Office, you can explore more advanced techniques and features to further enhance your flowcharts.
21How to Create a Flowchart in Microsoft Excel
A flowchart is a visual representation of a system, process, or workflow. It uses different shapes to represent stages or steps in the system and arrows to show the flow or sequence of events. If you want to create a flowchart in Microsoft Excel, there is a built-in tool called SmartArt that makes it quick and easy to draw a flowchart.
To create a flowchart in Excel, follow these steps:
- Open an Excel worksheet where you want to create the flowchart. You can also use a blank worksheet for this purpose.
- Select the “Insert” tab in the Office Ribbon at the top of the Excel window. Click on the “SmartArt” button in the “Illustrations” group.
- A dialog titled “Choose a SmartArt Graphic” will appear. In the left pane, select the “Process” category and click on the desired flowchart layout. Popular options include “Basic Flowchart” and “Continuous Process”.
- Click the “OK” button to insert the selected flowchart layout into your worksheet. It will appear as a special SmartArt object.
- The flowchart will have a titled “Text” pane next to it. Click on this pane and enter the text for each step or stage of your flowchart. You can also click on the edge of each shape to add text directly inside the shape.
- To add more shapes to your flowchart, click on the “Add Shape” button in the SmartArt Tools Design tab. Select the type of shape you want to add, such as a rectangle or a parallelogram. The new shape will appear connected to the existing flowchart.
- To connect two shapes with a straight line or arrow, click on the first shape and a diamond-shaped handle will appear. Click and drag this handle to the second shape and release the mouse button. The two shapes will be connected with a line. Repeat this step for other shapes.
- To format your flowchart, select the SmartArt object and use the formatting options in the SmartArt Tools Design and Format tabs. You can change the colors, layout, style, and other settings to customize the appearance of your flowchart.
Excel’s SmartArt feature uses a grid or matrix-like structure to automatically arrange your flowchart elements, making it easier to create and modify them. It also allows you to add more stages or steps to your flowchart as needed.
By following these steps, you can quickly create a flowchart in Microsoft Excel. It’s a useful tool for visualizing processes, workflows, decision-making flows, and many other types of systems.
How to Create a Flowchart in WPS Excel
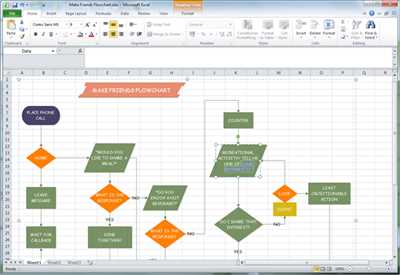
Flowcharts are diagrams that visually represent the flow of a process or system. They use different shapes, such as rectangles, circles, diamonds, and arrows, to show the steps and connections between them. Flowcharts are often used to illustrate complex processes in a clear and organized manner. If you need to create a flowchart in WPS Excel, follow these step-by-step instructions to learn how:
- Open a new or existing worksheet in WPS Excel. It’s recommended to have a dedicated worksheet titled “Flowchart” for clarity.
- Select the “Insert” tab at the top of the Excel window, then click on the “Shapes” icon in the “Illustrations” group. A dropdown menu will appear with various shape options.
- Scroll down and select the shape that represents the first step or stage of your flowchart. For example, you can choose a rectangle to symbolize a process.
- Click and drag on the worksheet to draw the shape. Release the mouse button when the shape reaches the desired size.
- Repeat steps 3 and 4 to add other shapes for the different stages or steps in your flowchart. Use the appropriate shapes for each stage, such as diamonds for decision points.
- Click on the “AutoShapes” icon in the “Drawing” group under the “Format” tab to change the appearance of the shapes. You can change the colors, add borders, or adjust the size and position of the shapes.
- Select the “Lines” or “Curves” option from the dropdown menu under the “AutoShapes” icon to connect the shapes with lines or arrows. Click and drag from one shape to another to create the connection.
- Use the “Text Box” option from the “Insert” tab to add text inside the shapes. Double-click on a shape and start typing to enter the text. You can also format the text using options from the “Home” tab.
- Continue adding shapes, connecting them, and adding text until your flowchart is complete. You can refer to the flow of the process or system you are illustrating to ensure the correct sequence of shapes.
- Save your flowchart by clicking on the “File” tab and selecting “Save” or pressing the shortcut “Ctrl + S”. Choose a location and a name for your file, then click “Save”.
Creating a flowchart in WPS Excel is a quick and easy process that allows you to customize the appearance and structure of your diagram. By following these steps, you can create a professional-looking flowchart to represent any process or system you need. Good luck!
Creating Flowchart in Excel
Flowcharts are an effective way to visually represent processes or workflows, and Microsoft Excel provides a convenient tool for creating them. With Excel, you can easily draw flowcharts by using various shapes and connectors.
To create a flowchart in Excel, follow these steps:
- Open Microsoft Excel and create a new blank worksheet.
- Click on the “Insert” tab in the top menu.
- In the “Illustrations” group, click on the “Shapes” button.
- A drop-down menu will appear with various shapes. Select the shape you want to use for the first step of your flowchart, such as a rectangle or a parallelogram.
- Click and drag on the worksheet to draw the shape. You can use the gridlines to align the shapes neatly.
- Repeat steps 4-5 to add other shapes for the different stages or steps of your flowchart.
- To connect the shapes, click on the “Insert” tab again and then click on the “Shapes” button.
- Select a connector shape, such as a straight or curved line, from the drop-down menu.
- Click and drag from the first shape to the second shape to connect them.
- Repeat steps 8-9 to connect other shapes in your flowchart.
- To customize the formatting of your flowchart, select a shape and use the formatting options in the “Format” tab.
- You can also add text to each shape by right-clicking on it and selecting “Edit Text”.
- Once your flowchart is complete, you can save it as an image or print it for reference.
Flowcharts created in Excel can be used for a variety of purposes, such as illustrating business processes, decision-making flows, or project timelines. They provide a visual representation of how a system or process flows, making it easier to understand and analyze.
Learning how to create flowcharts in Excel is a valuable skill that can be applied in various fields and industries. It allows you to present complex information in a clear and organized manner, aiding in effective communication and decision-making.
So, if you want to visualize your ideas or processes, give flowcharting in Excel a try. It can help you create professional-looking flowcharts quickly and easily.
Step 1
To create a flowchart in Excel, the first step is to open a new or existing worksheet in Microsoft Excel. Excel is a widely used spreadsheet program in the Office suite, and it has several features that can be used to create flowcharts.
Once you have your Excel worksheet open, you can begin creating your flowchart. Flowcharts are diagrams that use specific shapes and connecting lines to show the flow of steps or stages in a process. These shapes can include rectangles, diamonds, ovals, and other common flowchart shapes.
To start creating your flowchart in Excel, first select the shape that you want to use for your first step or stage. You can find these shapes under the “Insert” tab in the ribbon. Click on the “Shapes” button, and a drop-down menu will appear with a variety of different shape options.
If you want to make your flowchart easier to read, you can also add a grid to your Excel worksheet. To do this, click on the “View” tab in the ribbon, then select the “Gridlines” checkbox under the “Show” section.
Once you have selected your shape and set up the grid, you can begin drawing your flowchart. Click on the area of the worksheet where you want to place your first shape, and it will appear. You can then customize the shape by right-clicking on it and selecting “Format Shape”. Here, you can change the color, size, and other formatting options for the shape.
To connect the shapes in your flowchart, click on the first shape, then hold down the Shift key and click on the second shape. A line will appear connecting the two shapes. You can repeat this process to connect additional shapes as needed.
Excel also has a feature called SmartArt, which can be used to create flowchart-like diagrams. To access this feature, click on the “Insert” tab in the ribbon, then select the “SmartArt” button. A window titled “Choose a SmartArt Graphic” will appear, where you can select the flowchart template that best matches your needs.
These are the basic steps for creating a flowchart in Excel. In the next steps, you can add additional elements such as text boxes to label your shapes, or add more shapes to represent different steps or stages in your flowchart. Remember to save your work frequently to ensure that you don’t lose any changes.
Step 2
After you have opened Microsoft Excel, the next step is to create a new worksheet where you will be able to draw your flowchart. To do this, follow these quick steps:
1. Open Microsoft Excel.
2. Click on the tab titled “Sheet 1” or any other sheet name that you want to create your flowchart on.
3. There will be a grid that appears. This grid is called the worksheet, and it is the part of the Excel program where you can enter and format data.
Now that you have set up your worksheet, you can start creating your flowchart. Here’s how:
1. Select the first shape that you want to use for your flowchart. Most flowcharts use different shapes to represent stages or steps in a process.
2. If you can’t find the shape you want, click on “More Shapes” in the Office Shapes group. This will open a new window with a selection of additional shapes that you can use.
3. To draw the shape onto your worksheet, click and hold the left mouse button, and then drag the mouse to create the shape. Release the mouse button when the shape is the size you want.
4. Repeat steps 1-3 for any other shapes that you want to add to your flowchart.
Now that you have the shapes for your flowchart, the next step is to connect them together to create the flow. Here’s how:
1. Click and hold the left mouse button on the shape that you want to link to another shape.
2. Drag the mouse to the shape that you want to link it to, and then release the mouse button. This will create a line between the two shapes.
3. Repeat steps 1-2 to link any other shapes that you want to connect in your flowchart.
In addition to connecting shapes, you can also customize the appearance of your flowchart. Here’s how:
1. Select the shape that you want to format.
2. Click on the “Format” tab in the Office Ribbon.
3. There will be several formatting options available that you can use to change the color, line style, or other elements of your shape.
Once you have finished creating and formatting your flowchart, you can save it as an image or print it out for reference. Now you know how to create a flowchart in Microsoft Excel!
Step 3
To create a flowchart in Microsoft Excel, you’ll need to know how to use shapes and connectors. Most flowchart diagrams use common shapes to represent different stages or steps in a system or process. In Excel, you can open a new worksheet to start drawing your flowchart.
The first step is to select the shapes you want to use. In Excel, click on the “Insert” tab and then click on the “Shapes” button. A grid of shape options will appear. Look for a shape called “Process” or “Rectangle” – this is the shape commonly used for steps in a flowchart. You can also use other shapes like a parallelogram for decision points or a diamond for special processes.
Once you have your shapes selected, you can start creating your flowchart. Click on the first shape that represents the starting point of your flow and drag it onto the Excel sheet. Then, click on the second shape that represents the next step and drag it to the right or below the first shape to create a visual flow. Repeat this process for all the steps or stages in your flowchart.
To connect the shapes, you can use connectors. In Excel, go to the “Insert” tab and click on the “Shapes” button again. This time, select a connector like a straight line or curved arrow. Click and drag from the first shape to the second shape to create a connection between them. Repeat this step for all the shapes you want to link together.
It’s important to note that you can also add special formatting and customize the appearance of your flowchart. Just select a shape or connector and use the formatting options in the Excel toolbar to change the color, style, or thickness of the line. This can make your diagram more visually appealing and easier to understand.
Once you have completed your flowchart, you can save it or copy and paste it into other Office programs like Word or PowerPoint. To save your flowchart as an image, go to the “File” tab and click on “Save As.” Choose an image format like JPEG or PNG, and give your flowchart a title. Then, click “Save” to save it to your desired location.
Now that you know the steps to create a flowchart in Excel, you can start using this powerful tool to visualize and communicate your processes effectively.