
Are you an aspiring graphic designer or just someone who wants to create eye-catching visual content for your blog, social media posts, or presentations? Piktochart is the perfect tool for you! With Piktochart, creating stunning infographics, posters, and even website designs becomes a simple and intuitive process.
The first step to creating a Piktochart is to sign up for an account. Just enter your email, pick a username and password, and you’re good to go! Piktochart also lets you sign in with your Facebook or Google account, so you don’t have to worry about remembering yet another set of login credentials.
Once you’re logged in, you can choose from a variety of templates to start your design. Piktochart has a wide range of templates for different purposes, whether you want to create an infographic, a poster, or a report. You can also start from scratch and design everything on your own if you prefer.
After choosing a template, it’s time to customize it to fit your needs. Piktochart has a user-friendly editing interface that makes it easy to add text, images, and graphics to your design. You can change the size, color, and font of your text, upload images from your computer, or choose from Piktochart’s library of existing images and backgrounds.
Once the basic content of your design is in place, you can think about the overall look and feel of your design. Piktochart lets you easily change the background color, add blocks to your design, and rearrange elements to create a visually appealing and cohesive design.
When you’re done creating and editing your Piktochart, you can then save it or export it in various formats. You can save it as an image file, download it as a PDF, or even embed it into a webpage. Piktochart also gives you the option to directly publish your design to WordPress, making it convenient for bloggers and website owners.
With Piktochart, creating professional-looking graphics and visual content is a no-brainer. Whether you’re a graphic design pro or a total beginner, you’ll find Piktochart’s intuitive and user-friendly interface a breeze to work with. So why wait? Sign up for a Piktochart account today and unleash your creativity!
Simple intuitive and easy to use
Piktochart lets you create eye-catching posters and infographics in a simple and intuitive way. Whether you’re a graphic designer or a newbie to design, Piktochart makes it a no-brainer to create stunning visuals from scratch.
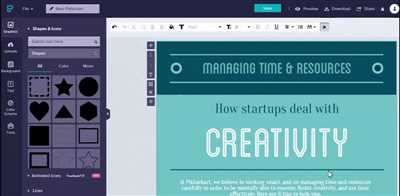
When you login to your Piktochart account, you’ll be greeted by a clean and easy-to-navigate dashboard. From here, you can choose a template that appeals to you and start customizing it to fit your content. Piktochart offers a wide range of templates and also allows you to create your own from a blank canvas.
With Piktochart’s drag-and-drop editor, adding text, images, and other graphic elements to your design is simple. Just click on a block, enter your content, and drag it around to position it on your webpage. You can also customize the fonts, colors, backgrounds, and more to make your design truly unique.
In addition to creating infographics, Piktochart also lets you make posters and other visual content. Just think of Piktochart as your go-to tool for creating captivating visuals for Facebook, email, and other marketing materials.
When you’re done editing your Piktochart creation, you can easily download it as an image file or share it directly to social media platforms like Facebook or WordPress. Piktochart also offers a handy email option that allows you to send your creation as a link or attached image to colleagues or clients.
Overall, Piktochart makes the process of designing professional-looking graphics a breeze. Its intuitive interface, wide variety of templates, and easy customization options make it a must-have tool for anyone looking to create visually stunning content.
Creating an Account in Piktochart
If you want to create eye-catching graphics, posters, or infographics, Piktochart is the perfect tool for you. It’s a no-brainer to sign up for an account on Piktochart and start designing amazing visual content.
To begin, go to the Piktochart website and click on the “Sign Up” button. You can sign up with your email or use an existing Facebook account.
Once you’ve created an account, you will be taken to the Piktochart dashboard. From here, you can choose to create a new graphic from scratch or customize a template. Piktochart has a wide range of templates to pick from, making it easy to find something that suits your needs.
When you’ve chosen a template or decided to start from scratch, enter your content and begin editing. Piktochart has a simple and intuitive editing interface that lets you add text, images, and backgrounds to your design. You can also customize how your content looks by changing the color scheme, fonts, and more.
Once you’re happy with your design, you can save it or export it to a webpage or WordPress. Piktochart also lets you share your creations on social media platforms like Facebook.
In conclusion, having an account on Piktochart makes it easy to create professional-looking graphics and visual content. Whether you’re a seasoned designer or just starting out, Piktochart is a valuable tool that lets you unleash your creativity without any hassle.
How to Create Infographics With Piktochart

Piktochart is a user-friendly online tool that allows you to create eye-catching infographics, posters, reports, and more. Whether you’re a seasoned designer or new to graphic design, Piktochart makes it simple and intuitive to design beautiful visuals.
When you start using Piktochart, you have the option to create a new graphic from scratch or choose from a library of templates. If you have a specific design in mind, you can also pick a template and customize it to suit your needs. Piktochart offers a wide range of templates, backgrounds, color schemes, and images to choose from, making it easy to create a design that goes well with your content.
The editing process in Piktochart is a no-brainer. Just click on the text or graphic you want to edit, and a simple editor pops up, allowing you to change the font, size, color, and alignment. You can also add and edit images, shapes, and icons to make your infographic more visually appealing.
If you’re having trouble coming up with ideas, Piktochart also offers pre-designed blocks and content such as charts, graphs, and icons that you can drag and drop onto your canvas. This feature saves you time and gives your infographic a professional look.
Piktochart lets you create infographics for a variety of purposes, whether it’s for a blog post, a school project, or a business report. Once you’re happy with your design, you can download it in various file formats, share it on social media platforms like Facebook, or embed it into your website or WordPress blog.
The best part about Piktochart is that it’s not just for designers. Even if you have no graphic design experience, you can still create stunning infographics using Piktochart’s user-friendly interface and intuitive features.
In conclusion, Piktochart is a powerful and easy-to-use tool that allows anyone to create professional-looking infographics. With its wide range of templates, intuitive editing tools, and customization options, Piktochart makes the process of creating eye-catching visuals a breeze.
Basic Housekeeping
When creating a piktochart, there are some basic housekeeping tasks that go into the process. Whether you’re starting from scratch or using a template, these steps will help you get started and ensure a smooth experience:
- Create or log into your piktochart account
- Choose a template or start with a blank canvas
- Customize the background color, choose from existing templates, or add your own
- Select eye-catching images from Piktochart’s library or upload your own
- Edit the text blocks to add your content
- Use simple and intuitive design tools to customize your graphic
- Think about the overall design and layout of your infographic
Piktochart also lets you edit existing templates, so if you see something you like, it’s a no-brainer to pick it and then make it your own.
Having trouble or want to add something specific to your design? Piktochart has a great customer support team and an active community of users you can turn to for help. You can reach out to them via email, or check out Piktochart’s Facebook page for tutorials and inspiration.
Once you’re happy with your design, simply click “Save” and then “Export” to download your piktochart as an image file. From there, you can use it on your website, blog, or social media accounts to share your content with the world!
Choose Your Visual Content
When it comes to creating eye-catching visual content, Piktochart makes it easy to customize existing templates or start from scratch. Whether you want to create infographics, posters, or social media graphics, Piktochart has got you covered!
First, choose a template that goes along with your content and design preferences. Piktochart offers a wide range of templates, each with their own color schemes, backgrounds, and block structures. You can browse through the templates to find the perfect one for your project.
Once you’ve chosen a template, it’s time to think about the visual elements you want to add to your design. Piktochart lets you pick from various sources, including custom images, icons, and even text. With an intuitive editing interface, you can easily enter your own text, edit existing text blocks, and add or remove elements to make your design unique.
Having a basic understanding of design principles comes in handy when creating visuals with Piktochart. Think about the overall color scheme, font styles, and visual hierarchy to ensure that your design is visually appealing and easy to read.
If you’re a Piktochart Pro user, you can also upload and use your own images to further customize your design. Piktochart lets you edit the images right within the platform, so there’s no need to switch to a separate image editing tool.
Once you’re happy with your design, you have the option to save it to your Piktochart account or download it as an image file. You can then use the image on social media platforms like Facebook, or incorporate it into your website or blog post.
Creating visual content with Piktochart is a no-brainer. Its easy-to-use interface, wide range of templates, and intuitive editing features make it accessible to both beginners and experienced designers alike. So go ahead and start creating stunning visuals with Piktochart!
Pick a Template or Start from Scratch
When it comes to creating infographics, posters, or any visual content for your webpage, Piktochart makes it a no-brainer. Whether you’re a beginner or an experienced designer, Piktochart offers a simple and intuitive platform that lets you create eye-catching designs without having to be a graphic designer.
To get started, first, you’ll need to create a Piktochart account. Just enter your email and a password, and you’re good to go. Once you have your account set up, you can choose to start from scratch or pick one of the many templates available.
If you’re new to creating visual content, it’s often best to choose an existing template. Piktochart has a wide range of templates to choose from, including templates for social media posts, presentations, reports, and more. Each template comes with a pre-designed layout and color scheme, so all you need to do is customize it with your own content.
If you prefer to create something completely unique, you can start from scratch. Piktochart’s intuitive editing tools let you add text, images, backgrounds, and more to your design. You can also customize the color scheme and layout to match your brand or personal style.
Once you’ve chosen a template or started from scratch, it’s time to get into the nitty-gritty of creating your Piktochart. The platform is designed to be user-friendly, with a drag-and-drop interface that makes customizing your design a breeze. Just click on a block or element to edit it, and Piktochart lets you enter your own text or replace images with your own.
With Piktochart, you have full control over every aspect of your design. You can easily add charts, graphs, icons, and other visual elements to make your infographic or post more engaging and informative. The platform also lets you upload your own images or choose from their library of stock photos and icons.
Creating a Piktochart is all about making your content visually appealing and easy to understand. Whether you’re creating an infographic, poster, or social media graphic, Piktochart’s user-friendly interface and intuitive design tools make it a breeze to create stunning visuals that will captivate your audience.
So whether you’re a beginner just getting started or an experienced designer looking to save time, Piktochart has everything you need to create professional-looking infographics and visual content. Pick a template or start from scratch, and let your creativity go wild!
Edit Existing Template Content
When it comes to creating eye-catching infographics, Piktochart makes it easy. With its intuitive graphic design tool, you can pick a template and add or edit the content to fit your needs.
First, start by entering your Piktochart account. From there, you can choose a template from the wide range of visually appealing backgrounds and designs. Whether you want to create a webpage, a Facebook post, or an email newsletter, Piktochart has templates for every occasion.
Once you have selected the template you want to use, the real fun begins. The easy-to-use interface lets you edit the existing content or create new blocks of text, images, or any other visual elements you desire.
When editing your template, Piktochart lets you customize every aspect of your design. You can change the color scheme, add basic or advanced content, and even upload your own images. The possibilities are endless!
When it comes to editing, Piktochart is a no-brainer. Just click on the element you want to edit, and the intuitive designer tool will guide you through the process. It’s as simple as that!
But Piktochart doesn’t stop with just editing. It also provides you with in-housekeeping tools to keep your design organized and professional.
If you’d rather start from scratch, Piktochart also lets you create your own custom templates. So, whether you’re a design pro or have no design experience at all, Piktochart has got you covered.
So, next time you’re thinking about creating an infographic, think Piktochart. With its easy-to-use interface, wealth of templates, and intuitive editing tools, Piktochart is the go-to choice for all your visual design needs.
Add New Content
When it comes to creating content with Piktochart, you have several options. You can either start with a template and customize it to your liking or create something from scratch. Piktochart offers a wide range of intuitive templates to choose from, making it easy to create eye-catching posters, infographics, and more.
If you’re a beginner or don’t have much design experience, using a template is a no-brainer. Simply pick a template, enter your text and images, and you’re good to go. Piktochart takes care of the basic graphic design for you, so you can focus on the content.
If you want more control over the design, you can also start with a blank canvas and add your own elements. Piktochart provides a simple editing interface that allows you to drag and drop blocks, choose backgrounds, customize fonts, and more.
Once you’ve created your content, you can easily share it with others. Piktochart gives you options to download your design as an image or PDF, or directly share it to social media platforms like Facebook or Twitter. You can also embed your Piktochart into a webpage or email it to someone.
Having an account with Piktochart makes it even easier to manage your designs. You can save your work, access it from anywhere, and collaborate with others. Piktochart also provides helpful housekeeping features like version control and auto-saving, so you never have to worry about losing your progress.
In conclusion, Piktochart is a powerful tool for creating visually appealing content. Whether you’re a seasoned graphic designer or a beginner, Piktochart has all the features you need to create stunning designs, no matter the occasion.
Customize Your Backgrounds

When it comes to creating custom and eye-catching piktocharts, one of the most important elements to think about is the background. The background of your piktochart can set the tone for the entire design and make it more visually appealing.
Piktochart provides you with a variety of templates to choose from, but if you want to create something completely unique, you can also start from scratch. With the intuitive and easy-to-use design editor, you can pick the colors and images that best fit your content and create a background that speaks to your audience.
If you’re not a graphic designer, don’t worry! Piktochart makes it easy for anyone to create professional-looking infographics, posters, and more. You can simply enter your content into the pre-designed templates and then go to the background settings to customize your design.
There are a few different ways you can customize your backgrounds in Piktochart. First, you can choose a color for your background. You can either enter the hex code for a specific color or use the color picker to find the perfect shade. You can also choose to use an existing image as your background, or upload your own.
When editing your background, you also have the option to add blocks of color or images over top of your existing design. This can help to break up the space and add visual interest to your piktochart. You can add text blocks, shapes, or icons as well.
To keep your design visually appealing and easy to read, it’s important to choose a background that doesn’t overpower your content. If you have a lot of text or data to display, it’s best to choose a background that is more neutral or muted in color. This will ensure that your audience can easily focus on the information you’re presenting.
Having a visually appealing and customized background can make a big difference when it comes to sharing your piktochart. Whether you’re creating a graphic for social media, a blog post, or an email newsletter, a well-designed background can catch the eye of your audience and make them more likely to engage with your content.
So, when you’re creating a piktochart, don’t forget to take the time to think about your backgrounds. Whether you’re using one of Piktochart’s templates or creating your own design from scratch, customizing your background can take your piktochart to the next level and make it stand out from the crowd.
Eye-catching posters
When it comes to creating eye-catching posters, Piktochart is the go-to tool. Whether you’re a graphic designer or just starting out, Piktochart makes it simple to create visually stunning posters that grab attention.
With Piktochart, you can choose from a library of templates or start from scratch. You can enter your own text, pick your desired background, add images, and customize the color scheme to match your content. Piktochart also lets you add basic shapes and graphics to further enhance your design.
Not only does Piktochart have a wide range of pre-made templates to choose from, but it also allows you to create custom designs. Piktochart lets you upload your own images, making it easy to incorporate your own brand or style into your posters.
Editing your Piktochart posters is intuitive and simple. With just a few clicks, you can edit, customize, and personalize your design to make it truly unique. Piktochart also offers easy sharing options, so you can easily share your posters on social media platforms like Facebook or even embed them into your own webpage.
One of the best features of Piktochart is the time-saving aspect. Instead of spending hours creating a poster from scratch, Piktochart provides a no-brainer solution. With its drag-and-drop interface, you can create professional-looking posters in a fraction of the time it takes with traditional design tools.
So, whether you’re a beginner or an experienced designer, Piktochart is the perfect tool to help you create eye-catching posters. With its user-friendly interface and extensive range of templates and customization options, Piktochart takes the stress out of poster design.
Sources
When it comes to creating colorful and eye-catching infographics, posters, and graphics, Piktochart is a no-brainer. With Piktochart, you can start from scratch or use existing templates to create your own customized designs with just a few clicks.
If you’re new to Piktochart, the process is simple and intuitive. Sign up for an account, choose a template that fits your design needs, and start editing. With Piktochart, you have the freedom to add and edit text, images, and graphics to make your content visually appealing.
Piktochart lets you choose from a wide range of designer-created templates and backgrounds. You can also upload your own images to personalize your designs even further. When it comes to editing your design, Piktochart provides basic tools to help you customize each element. From changing the color and font of your text to adding blocks of content, Piktochart makes it easy to create a visually stunning infographic or webpage.
Whether you want to create infographics for your blog or social media posts for Facebook, Piktochart has you covered. Its user-friendly interface and intuitive design make it a go-to tool for anyone looking to create eye-catching visuals.
So, if you’re thinking about how to make a Piktochart, just remember to start by choosing a template that suits your needs. From there, it’s as simple as dragging and dropping elements, editing text, and adding your own personal touch to create a one-of-a-kind design.
Having a Piktochart account also means you can easily save your designs and come back to them later. Piktochart also offers the option to download your designs as a PDF or image file, making it convenient for sharing or printing.
When it comes to creating visually appealing content, Piktochart is a top choice for both beginners and experienced designers. Its easy-to-use interface, wide selection of templates, and ability to customize designs make it a must-have tool for anyone looking to create stunning visuals without the need for advanced graphic design skills.