In the world of programming, algorithms play a crucial role in the development process. They are step-by-step instructions that define how a program should work, helping developers solve complex problems efficiently. One popular and comprehensive way to visualize an algorithm is by creating a flowchart.
A flowchart is a graphical representation of a process or algorithm. It uses different shapes, such as rectangles, diamonds, and arrows, to depict the various steps and decision points involved. Flowcharts provide a visual guide that makes it easier to understand and decode the logic behind a program.
If you want to create a flowchart for your algorithm, you can do so using various tools. One option is to use Microsoft Word, a widely-used word processing program. Word provides a built-in tool called SmartArt that offers several different flowchart shapes and connectors.
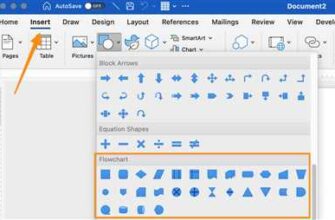
To create a flowchart in Word, start by clicking on the “Insert” tab at the top of the screen. Then, choose the “SmartArt” option from the toolbar. In the SmartArt gallery, you will see several categories and options for different types of flowcharts. Select the one that best suits your needs.
Once you have chosen the right flowchart shape, you can start adding the steps of your algorithm. Click on the shape to open a text box, and then type in the step or process that it represents. Repeat this process for each step in your algorithm, connecting them using arrows to show the direction of the flow.
In addition to the standard flowchart shapes, you can also use terminal shapes to indicate the start and end of the algorithm. These shapes are typically represented by rounded rectangles. By clicking on them, you can add text to explain the purpose and conclusion of your algorithm.
To make your flowchart more comprehensible, you can also color-code the shapes and arrows. For example, you can use different colors to represent different types of steps or decision points. This helps users understand the flow and logic of the algorithm at a glance.
When you have completed your flowchart, it’s important to review and test it to ensure its accuracy and clarity. Step through each step and decision point to make sure the flow is correct. Additionally, consider sharing your flowchart with others to get feedback and improve its usability.
In this article, we have shown you how to create an algorithm flowchart using Microsoft Word. Flowcharts are a powerful and visual tool that can aid in understanding and designing algorithms. By following these simple steps, you can create a comprehensive and easy-to-follow flowchart for your next programming project.
See also: How to optimize algorithms for efficiency
Decoding Algorithm Flowchart: Your Comprehensive Guide
In the world of programming, algorithms play a crucial role in solving complex problems. One way to visualize and understand an algorithm is by using a flowchart. Flowcharts provide a step-by-step graphical representation of a process or an algorithm.
When creating an algorithm flowchart, you have several options to choose from. One common tool is the Microsoft Word program, which has a built-in feature for creating flowcharts. In this comprehensive guide, we will show you how to decode algorithm flowcharts using Word.
-
To start, open Microsoft Word and create a new document. Then, click on the “Insert” tab at the top of the screen.
-
Inside the “Insert” tab, you will see a section called “Illustrations.” Click on the “SmartArt” option.
-
A gallery of different SmartArt options will appear. For creating an algorithm flowchart, choose the “Process” option.
-
After selecting the “Process” option, a standard flowchart template will appear with predefined shapes and connectors.
-
Now, it’s time to make your algorithm flowchart. You can choose from various shapes and colors to represent different steps or processes.
-
To add a shape, simply click on one of the existing shapes, and a new shape will appear connected by an arrow.
-
If you want to connect two shapes that are not already connected, you can do so by clicking on the existing shape, and then clicking on the crosshair connector on the shape you want to connect it with.
-
Inside each shape, you can add text to describe the step or process. You can also change the color of the shape by right-clicking on it and selecting “Format Shape.”
-
Continue adding shapes and connecting them until your algorithm flowchart is complete.
-
When you have finished creating your flowchart, you can see a preview by clicking on the “Design” tab and selecting “Preview.”
Flowcharts are a powerful tool to visualize and understand algorithms. By following the steps in this tutorial, you can create your own algorithm flowchart using Microsoft Word. So next time you need to decode an algorithm, remember to refer to this comprehensive guide!
How To Make A Flowchart In Word
If you are looking to create a flowchart for a program or a process, Microsoft Word provides a convenient tool that allows you to easily create and customize your own flowcharts. In this comprehensive tutorial, we will show you how to make a flowchart in Word using the program’s built-in tools.
To start creating your flowchart, open Microsoft Word and navigate to the “Insert” tab at the top of the screen. In the “Illustrations” group, you will see a “SmartArt” option. Click on this option to open the SmartArt Gallery.
In the SmartArt Gallery, choose the “Process” category on the left-hand side. You will see a variety of different flowchart shapes that you can use to represent the steps in your algorithm or process. Click on the shape that you want to use as your main flowchart shape.
After selecting your main flowchart shape, click on the “OK” button. You will see the shape inserted into your Word document. To add more shapes to your flowchart, click on the shape that you want to connect to the main shape and click on the “Design” tab that appears on the top toolbar.
Inside the “Design” tab, you will find various options to customize your flowchart. For example, you can change the color of the shapes by clicking on the “Change Colors” option. You can also add arrows to show the direction of the flow by clicking on the “Add Shape” option.
To move the shapes around, simply click and drag them to the desired location. To connect shapes with connectors, click on the “Insert Shape” option and choose the type of connector you want to use (e.g., straight connectors, elbow connectors). Click and drag from one shape to another to create the connection.
When you are finished creating your flowchart, click outside of the flowchart area to exit the editing mode. You can also resize the flowchart by dragging the corner handles of the selected flowchart shape.
Flowcharts are a common tool used in the programming world, as they help visualize the steps and logic of algorithms. By using Microsoft Word’s built-in tools, you can easily create professional-looking flowcharts to document and demonstrate your algorithms.
In conclusion, this article has provided a step-by-step guide on how to make a flowchart in Word. By following the steps outlined, you can create flowcharts that are not only visually appealing but also comprehensive in showing the process flow and terminal points of your algorithm. So, give it a try and start creating your own flowcharts in Word today!
1 Using Shapes
When creating an algorithm flowchart, you can use shapes to represent different parts of your program. These shapes help to visually organize the logic and flow of your algorithm.
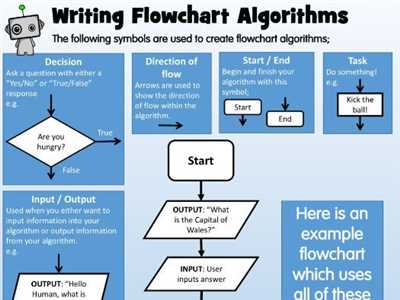
There are several common shapes that are used in flowcharts, such as the process shape, which represents a specific action or step in the algorithm. The decision shape, on the other hand, is used to show a condition or choice that the program will make. The terminal shape is typically used at the beginning and end of the flowchart to define the start and end points of the algorithm.
To insert shapes into your flowchart, you can use the drawing tool in your word processing program or choose from a gallery of predefined shapes. Most programs have a standard set of shapes that you can use, but you can also create your own custom shapes if you want.
When inserting a shape, you can then move it around the canvas by clicking and dragging. You can also resize the shape by clicking and dragging the handles on the sides or corners. If you want to change the color of the shape, you can do so by selecting a different color from the options provided.
Connecting shapes in a flowchart is a crucial step in creating a comprehensive algorithm. To connect shapes, use arrows or connectors that show the direction of the flow. You can use standard arrows or choose from a variety of connector options, such as straight lines or curved lines.
Inside each shape, you can provide a description or definition of the step or process it represents. This helps in decoding the algorithm and understanding the logic behind each step.
For a more visual guide, you can also use SmartArt graphics or other visual tools available in your word processing program. These tools provide comprehensive templates and styles to make your flowchart more visually appealing.
| Shape | Description |
|---|---|
| Process | Represents a specific action or step in the algorithm |
| Decision | Shows a condition or choice that the program will make |
| Terminal | Defines the start and end points of the algorithm |
By following these steps and using the appropriate shapes and connectors, you can create an effective and easy-to-read flowchart for your algorithm.
2 Using SmartArt
If you prefer to create a flowchart using a more visual approach, Microsoft Word provides a tool called SmartArt. SmartArt is a feature that allows you to create professional-looking diagrams and graphics directly in Word. This makes it a great option for creating flowcharts, as it provides several different predefined layouts and styles that can be easily customized to fit your needs.
To create a flowchart using SmartArt, follow these steps:
- Open a new Word document and click on the “Insert” tab in the ribbon.
- In the “Illustrations” group, click on the “SmartArt” option.
- In the “Choose a SmartArt Graphic” window, navigate to the “Process” category and select the desired flowchart layout.
- Click on the “OK” button to insert the selected SmartArt layout into your document.
- A new SmartArt graphic will appear in your document, showing the main steps of your algorithm.
- Click on the individual shapes in the SmartArt graphic to enter your algorithm’s steps.
- Use the provided arrows and connectors to show the flow and direction of your algorithm.
- Insert additional shapes or connectors by clicking on the crosshair icon that appears when you move your cursor over an existing shape or connector.
- Customize the colors and styles of the flowchart by clicking on the “Design” tab in the SmartArt Tools ribbon.
- When you are satisfied with your flowchart, save and print your document.
Using SmartArt to create flowcharts can make the process much easier, especially for those who are not familiar with the standard flowchart symbols and connectors. The SmartArt tool provides a user-friendly interface that guides you through the steps of creating a flowchart. It also allows for more comprehensive customization options, such as choosing different flowchart layouts and color schemes, which can help make your flowchart more visually appealing.
In the next article, we will see how to create a flowchart using a different tool, and decode the main steps of algorithms.
Definition of Flowchart
A flowchart is a visual representation of a process or algorithm. It is a diagram that shows the steps involved in a program or task, allowing you to see the flow of the process. In a flowchart, different shapes and connectors are used to connect the steps in a logical and organized manner.
Flowcharts are commonly used in programming and other fields where processes need to be understood and followed. They provide a comprehensive view of the algorithm or process, making it easier to understand and analyze.
To create a flowchart, you can use various tools such as Microsoft Word, PowerPoint, or specialized flowchart software. These tools provide a gallery of standard flowchart shapes and connectors that you can choose from. By dragging and clicking the shapes and connectors, you can insert them into your flowchart and connect them together to represent the flow of your algorithm or process.
Common flowchart shapes include:
- Terminal: Represents the start or end of a process.
- Process: Represents a specific action or task.
- Decision: Represents a decision point, where the flow can take different directions.
- Connector: Connects different shapes together, indicating the flow from one step to another.
By adding colors, arrows, and other visual elements, you can make your flowchart more visually appealing and easier to understand. The flowchart can be as simple or as complex as needed to depict the process accurately.
When creating a flowchart, there are several steps to follow:
- Start by defining the main objective of your flowchart and what process or algorithm it will represent.
- Identify the different steps or actions that are a part of the process.
- Choose the flowchart shapes that best represent each step.
- Connect the shapes using arrows or connectors to show the flow from one step to another.
- Add any additional information or conditions inside the shapes, if needed, for more comprehensive flowchart.
- Review and refine your flowchart to ensure accuracy and clarity.
Flowcharts are widely used in the programming world and various other industries as a visual tool to analyze, decode, and improve processes. They provide a clear representation of a process or algorithm, helping users to understand and follow the steps in a logical and efficient manner.
So, if you want to create a flowchart for your algorithm or process, start by choosing a flowchart tool or using Microsoft Word’s SmartArt option. Then, follow the steps mentioned above to create a comprehensive flowchart that visually represents the flow of your process or algorithm.
See Also
If you want to create an algorithm flowchart, you should familiarize yourself with the main steps involved in the process. You can see a comprehensive guide on how to create an algorithm flowchart by clicking on the “How to create an algorithm flowchart” tutorial. This article will show you the different shapes and connectors you can use to create your flowchart, as well as how to make it more visually appealing by using color.
In addition, you can also use the “Insert” option to add different types of flowcharts, such as the “Basic Flowchart” or the “Cross-Functional Flowchart,” to your program. These flowcharts provide a standard set of shapes and arrows that you can use to represent the different steps of your algorithm.
When creating your flowchart, there are several common steps that you should follow. First, you should define the main purpose of your algorithm and the direction in which it will flow. Then, you can use the different shapes and connectors from the “Flowchart Shapes” gallery to visually represent the different components of your algorithm. You can also use the “SmartArt” tool to create a more visually appealing flowchart.
One important feature that you should be aware of is the “Terminal” shape, which represents the start and end points of your algorithm. By default, this shape is represented by a rounded rectangle. However, you can choose from several different shapes and colors to customize the appearance of your flowchart.
Finally, it is also important to mention the “Decoding Algorithm” option, which allows you to see the step-by-step process of your algorithm. By clicking on this option, you can see a word-by-word definition of each step, making it easier to understand and debug your algorithm.
In conclusion, this article has provided a comprehensive guide on how to create an algorithm flowchart. By following the main steps and using the various shapes and connectors available, you can create a clear and visually appealing flowchart that represents your algorithm in a structured and easy-to-understand manner.
Tutorial
If you want to create an algorithm flowchart, there are several steps you need to follow. In this tutorial, we will show you how to create a flowchart using the main tools and features in Microsoft Word.
To begin, open Microsoft Word and click on the “Insert” tab at the top of the program. Inside the Insert tab, you will see a tool called “SmartArt”. Click on this option to open the SmartArt gallery.
When the SmartArt gallery opens, choose the option called “Process” to see a selection of different shapes you can use to make your flowchart. There are also other options such as “Hierarchy”, “Relationship”, and “Cycle” that you can explore.
Once you have selected the desired shape, click on it to insert it into your document. You can then move the shape around the document by clicking and dragging it with your mouse. To resize the shape, click and drag the corner handles.
To connect the shapes and illustrate the flow of your algorithm, you can use the arrows and connectors available in the SmartArt tool. Click on the shape you want to connect and then click on the arrow or connector you want to use. The arrow will automatically connect the two shapes in the direction you choose.
In addition to the standard shapes and connectors, there is also an option to customize the colors and styles of your flowchart. To do this, select the shape or connector and click on the “Format” tab that appears when you have a shape selected. From here, you can choose different fill colors, line styles, and other formatting options.
One common feature in flowcharts is the use of terminal shapes to indicate the start and end points of the algorithm. To add a terminal shape, follow the same steps as before, but choose the “Terminal” option from the SmartArt gallery.
As you create your flowchart, remember to label each shape and include a clear direction for the flow of the algorithm. This will make it easier for others to understand and follow your flowchart.
This tutorial has provided a comprehensive guide on how to create an algorithm flowchart using the tools and features in Microsoft Word. By following these steps, you can create a clear and visually appealing flowchart to represent your algorithms.