Flowcharts are a useful tool for mapping out processes and decision-making within a workflow. They provide a visual representation of the steps and structure of a process, making it easier to understand and identify any gaps or mistakes. Whether you are building a flowchart for personal use or for a professional project, this tutorial will guide you on how to create impactful flowcharts using different drawing options and templates.
1. Start by outlining the process or workflow you want to depict in your flowchart. Identify the different steps and decision points within the process. This will help you understand the flow and structure of your flowchart.
2. Choose a flowchart template that fits your needs. There are various templates available online, both free and paid. Microsoft Word and Mural offer downloadable templates that you can use. These templates provide a basic structure for your flowchart, making the drawing process easier.
3. When creating your flowchart, use different shapes to represent different types of actions or decisions. Common flowchart symbols include rectangles for actions, diamonds for decision points, and arrows to indicate the flow of the process. This will make your flowchart more understandable and accessible to others.
4. Use sticky notes and text boxes to provide instructions or additional notes within your flowchart. This will help clarify any unclear steps or provide more information about the process. Being able to add resizable data tags and notes can enhance the navigation and understanding of the flowchart.
5. Edit and export your flowchart. Once you have completed your flowchart, review it for any mistakes or inconsistencies. Make sure the flow makes sense and that all the necessary steps are included. Then, export your flowchart to a file format of your choice. This will allow you to share or edit the flowchart in the future.
By following these instructions, you will be able to create a clear and informative flowchart that can be used to enhance your decision-making and understanding of various processes. Whether you are using flowcharts for personal or professional purposes, building them step by step will help you identify the most impactful options and avoid common mistakes.
- How to Make a Flow Chart in Word Step by Step Guide
- Flowchart Tutorial
- Step 1: Understand the Basics
- Step 2: Use Flowchart Templates
- Step 3: Start Drawing
- Step 4: Enhance Your Flowchart
- Step 5: Export and Share
- What are the 4 Types of Flowcharts
- 1 Process Flowcharts
- 2 Swimlane Flowcharts
- 3 Data Flowcharts
- 4 Workflow Diagrams
- Mural makes building flowcharts easier and more impactful
- Sticky notes text
- Mapping and diagramming
- Infinite Resizable Canvas Options
- Tags on sticky notes
- Outline navigation instructions
- Export
- When to use a flowchart
- Video:
- How to Make a Flowchart in 60 (ish) Seconds!
How to Make a Flow Chart in Word Step by Step Guide
A flowchart is a visual representation of a process or workflow, which makes it easier to understand and navigate complex systems. Flowcharts can be used to map out decision-making processes, outline data flows, or provide a guide for building impactful workflows. Microsoft Word provides a range of options and features that can enhance your flowchart diagrams.
Step 1: Open Microsoft Word and create a new document
To begin, open Microsoft Word and create a new document. This will serve as the canvas for your flowchart.
Step 2: Use Flowchart templates or start from scratch
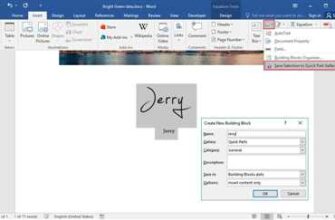
Word provides various flowchart templates that you can use as a starting point. These templates include common flowchart shapes and symbols that you can drag and drop onto your canvas, making it easier to create your flowchart. If you prefer to start from scratch, you can simply use basic shapes and connectors to build your flowchart.
Step 3: Add flowchart symbols and connectors
When creating a flowchart, you will need to use different types of symbols and connectors to represent different steps or processes. Some common flowchart symbols include rectangles for processes, diamonds for decision-making points, and arrows to show the flow between steps. Word provides a range of shapes and connectors that you can use to create your flowchart.
Step 4: Edit and enhance your flowchart
Once you have created your flowchart, you can edit and enhance it to make it more visually appealing and informative. You can add text to each shape to provide instructions or notes, resize and reposition shapes, and add color or formatting to make your flowchart stand out. Word also provides options for grouping shapes together, aligning them, and adding additional labels or annotations.
Step 5: Export or print your flowchart
Once you are satisfied with your flowchart, you can export it as an image or print it directly from Word. This will allow you to share your flowchart with others or use it as a reference in your work.
Step 6: Mistakes are useful!
Don’t be afraid to make mistakes when creating your flowchart. Mistakes can often lead to new and creative ideas, and they can also help you understand the structure and flow of your process better. If you make a mistake, simply undo or delete the shape or connector and try again.
In conclusion, Microsoft Word provides a user-friendly interface and a range of features that make it easy to create flowcharts. Whether you are a beginner or an experienced flowchart designer, Word has the tools you need to create informative and visually appealing flowcharts.
Flowchart Tutorial
In this tutorial, we will guide you on how to create an impactful flowchart using HTML. Flowcharts are useful for mapping out and understanding the flow of various processes or workflows. They provide a visual representation of the steps involved in a process, making it easier to identify common mistakes and improve efficiency.
Step 1: Understand the Basics
Before diving into creating a flowchart, it is important to understand the basic structure and elements of a flowchart. Flowcharts consist of different shapes and symbols that represent different actions or steps in a process. Some common flowchart symbols include rectangles for processes, diamonds for decision points, and arrows for flow or navigation between steps.
Step 2: Use Flowchart Templates
To make the process of creating a flowchart easier, you can use resizable flowchart templates. These templates provide pre-made shapes and symbols that you can simply drag and drop onto the canvas. They also come with options to edit text and customize the appearance of the flowchart.
Step 3: Start Drawing
When you have a clear understanding of your process or workflow, start by outlining the steps in the flowchart. Use the appropriate symbols and connect them using arrows to indicate the flow of data or actions. Take notes or add comments within the flowchart to provide additional instructions or explanations.
Step 4: Enhance Your Flowchart
To make your flowchart more visually appealing and easy to understand, you can add color, shading, or use sticky notes to provide additional information. Use different colors to differentiate between different types of processes or highlight important steps.
Step 5: Export and Share
Once you have finished creating your flowchart, you can export it to various formats, such as PDF or an image file, for easy sharing and collaboration. You can also embed the flowchart within your website or Microsoft Word document to enhance your written content.
By following these instructions, you will be able to create a professional-looking flowchart that effectively communicates your process or workflow. Remember to review and iterate on your flowchart as needed, and don’t be afraid to seek feedback or get input from others to ensure accuracy and clarity.
What are the 4 Types of Flowcharts
A flowchart is a visual representation of a process that outlines the steps or actions required to complete it. Flowcharts are used in various industries and disciplines to make complex processes easier to understand and navigate. They can provide a step-by-step guide on how to build, map, and analyze your processes.
There are four common types of flowcharts:
-
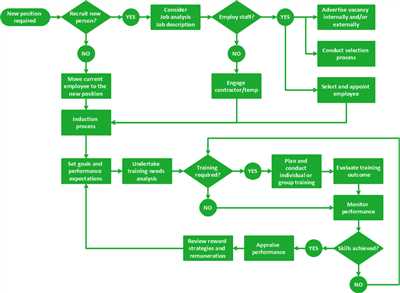
Process Flowchart: This is the most common type of flowchart used in business. It shows the steps and actions required to complete a process, from start to finish. Process flowcharts are often used to identify bottlenecks, improve efficiency, and streamline operations. They can be created with various software options, such as Microsoft Word or specialized flowcharting software.
-
Workflow Diagram: This type of flowchart focuses on the flow of information, documents, or data between different individuals, departments, or systems within an organization. Workflow diagrams are useful for understanding the sequence of activities and decision-making points within a process. They are commonly used for project management or business process analysis.
-
Swimlane Diagram: Also known as cross-functional flowcharts, swimlane diagrams show the interactions between different individuals, departments, or functions within a process. Each swimlane represents a specific role or department, and the flowchart illustrates how tasks and information are passed between them. Swimlane diagrams enhance understanding by providing context and clarifying responsibilities in complex processes.
-
Decision-Making Flowchart: These flowcharts are used to illustrate the decision-making process and the options available at each step. Decision-making flowcharts commonly use different shapes to represent decisions, actions, or outcomes. This type of flowchart is particularly useful for making complex decisions or determining the best course of action in a given situation.
By choosing the right type of flowchart and following the instructions, building a flowchart becomes much easier. There are various templates and software options available that make the process of creating flowcharts more efficient and impactful. Whether you are using Microsoft Word, a specialized flowcharting software, or an online platform like Mural, the important thing is to outline your processes clearly and identify the steps and decision points within them.
With the help of flowcharts, you can visualize your processes, understand their structure, and identify any mistakes or areas for improvement. Flowcharts can be exported to different formats, making them easy to share and collaborate with others. They can also be resized and edited as needed, allowing you to update and adjust your flowchart as your processes evolve.
In conclusion, flowcharts are a valuable tool for understanding and improving processes. The 4 types of flowcharts outlined above provide different options for representing and analyzing workflow, decision-making, and information flow. By using the right type of flowchart and following the guidelines, you can enhance your understanding of processes and make more informed decisions.
1 Process Flowcharts
In this tutorial, we will explore the different types of flowcharts and how to create them using a flowchart template. Flowcharts are useful diagrams that help in understanding the structure and processes within a system or workflow. They are commonly used to map out a step-by-step guide for a process or identify the flow of data between different elements.
When drawing a flowchart, it is important to use the various options and templates provided by tools like Microsoft Word or Mural. These tools offer resizable canvas options and allow for easy navigation between different sections of the flowchart.
Flowcharts can be used to visualize a wide range of processes and are most commonly used in project management, software development, and business analysis. They provide a clear outline of the steps involved in a process and help in identifying any potential mistakes or areas for improvement.
To create an impactful flowchart, start by outlining the process or workflow that you want to represent. Then, use the flowchart templates and tags available in your chosen diagramming tool to make the drawing process easier. You can also enhance the flowchart with sticky notes or additional text to provide more context or instructions.
Once the flowchart is complete, you can export it as an image or PDF file to share with others. This makes it easier to collaborate and receive feedback on the flowchart.
Flowcharts are commonly used in a variety of industries due to their ability to make complex processes easier to understand. Whether you are making a flowchart for a simple task or a complex workflow, following these steps will help you create a clear and concise visual representation of the process.
Overall, process flowcharts are a useful tool for identifying the steps involved in a process and understanding the flow of data between different elements. By using a flowchart template and following the instructions provided, you can create a clear and easy-to-understand flowchart that will guide you through your processes.
2 Swimlane Flowcharts
Swimlane flowcharts are a type of process mapping diagram that is commonly used to understand and visualize workflows. They are useful when you want to identify the flow of data and processes within a particular system or organization.
There are different types of swimlane flowcharts, each with its own set of instructions and examples. They can help you create a clear and structured chart that makes it easier to understand the flow of processes and make decision-making more impactful.
One of the most common tools for building swimlane flowcharts is Microsoft Word, which provides various templates and drawing tools to help you create your diagram. Another popular option is Mural, an online collaboration platform that allows for real-time editing and provides an infinite canvas for your flowchart.
When building a swimlane flowchart, it is important to start with an outline of the processes and data flow. Then, you can use sticky notes or different tags to identify the different swimlanes within your chart. This will help enhance the understanding of the flow and structure of your workflow.
There are 4 main steps to building a swimlane flowchart:
- Identify the processes and data flow
- Create swimlanes and assign them to the relevant departments or individuals
- Draw the flow of processes and data between swimlanes
- Add notes or text to provide additional instructions or information
By using swimlane flowcharts, you can create a visual representation of your processes that is easy to understand and navigate. You can also export your flowchart to share it with others or edit it further.
Swimlane flowcharts are commonly used in various industries and departments, such as project management, sales, and operations. They can help identify bottlenecks and areas for improvement within a workflow, making them a valuable tool for process mapping and decision-making.
To make it even easier, there are downloadable templates available that you can use as a starting point for your swimlane flowchart. These templates are resizable and can be edited to fit your specific needs.
Overall, swimlane flowcharts are a useful tool for understanding and mapping the flow of processes and data within a system or organization. They can help you identify common mistakes, enhance decision-making, and provide a clear structure for your workflow. Whether you use Microsoft Word, Mural, or other tools, creating swimlane flowcharts will make it easier to visualize and understand your processes.
3 Data Flowcharts
When it comes to building flowcharts, one of the most useful and common types is the data flowchart. Data flowcharts are used to visually represent the flow of data between processes or decision-making points. By mapping out the data flow, you can better understand how information moves through your workflow and identify any potential bottlenecks or areas for improvement.
There are various tools and options available to help you create data flowcharts. Microsoft Word, for example, provides templates and instructions for building flowcharts. You can also use specialized diagramming software like Microsoft Visio or online tools like Mural or Lucidchart, which offer more features and options for customization.
One of the key features of data flowcharts is the use of symbols and tags to represent different elements in the flowchart. For example, a process is represented by a rectangle, a decision point is represented by a diamond, and data inputs and outputs are represented by arrows. These symbols and tags make it easier to understand the flow of data and the relationships between different processes.
Another important aspect of data flowcharts is the structure and layout. Flowcharts can be drawn in a step-by-step or an outline format, depending on what makes the most sense for your process. You can also use swimlane flowcharts, which divide the flowchart into different lanes or columns to show the responsibilities or roles of different individuals or departments.
In addition to the visual components, data flowcharts can also include text and notes to provide further explanations or instructions. This is especially useful when collaborating with others or when sharing the flowchart with others who may not be familiar with the process. Including clear and concise text will enhance the understanding and usefulness of your flowchart.
Data flowcharts are not only helpful for understanding processes and workflows, but they can also be used to enhance decision-making. By visualizing the flow of data, you can identify the impact of different decisions on the overall process and make more informed choices.
There are three common types of data flowcharts:
- Process Flowcharts: Used to illustrate the step-by-step process of how data moves through a system or a business process. These flowcharts can help identify inefficiencies or areas for improvement.
- System Flowcharts: Used to depict the relationship and interaction between different systems or components. They show how data flows between different systems and can help identify integration issues or dependencies.
- Workflow Flowcharts: Used to illustrate the flow of tasks or actions within a specific workflow or process. These flowcharts can help identify bottlenecks or areas where tasks are getting delayed or stuck.
By using data flowcharts, you can make your decision-making processes more impactful and the overall navigation of your workflow easier. It’s important to choose the right type of flowchart for your specific needs and to ensure that the flowchart is clear, understandable, and resizable. Once you have created your flowchart, you can edit, export, or share it with others to help guide their understanding or provide instructions for a specific process.
For a more detailed tutorial on how to build flowcharts, you can download various templates and examples available online. These resources will provide you with step-by-step instructions on how to create different types of flowcharts and offer tips and best practices to avoid common mistakes.
In summary, data flowcharts are a valuable tool for understanding and visualizing the flow of data within a process or workflow. They make decision-making easier, help identify areas for improvement, and enhance the overall understanding of a specific process. By using the right tools and following best practices, you can create impactful and effective data flowcharts.
4 Workflow Diagrams
Workflow diagrams are a useful tool for mapping out the steps and processes involved in a particular workflow or process. They help to provide a visual representation of the flow of data and the decision-making points within a process. By outlining these steps in a flowchart, you can more easily understand the structure of the workflow and identify any common mistakes or areas for improvement.
There are various types of workflow diagrams that can be used in different situations. In this tutorial, we will discuss four common types of workflow diagrams and provide examples of how to create them using Microsoft Word, Mural, and other diagramming tools.
1. Flowchart: Flowcharts are the most common type of workflow diagram and are often used to depict the flow of a process step by step. They use different symbols and shapes to represent each step or decision point, making it easier to navigate and understand the workflow. Flowcharts can be created using software like Microsoft Word or online diagramming tools like Lucidchart. They can also be made on a whiteboard or with sticky notes, allowing for easy editing and resizing.
2. Swimlane Diagram: Swimlane diagrams are a type of flowchart that helps to identify the different parties or departments involved in a process and their responsibilities. In a swimlane diagram, each swimlane represents a different party, and the steps of the workflow are placed within the appropriate swimlane. This type of diagram is commonly used in business process mapping to enhance understanding and communication between different stakeholders.
3. Data Flow Diagram: Data flow diagrams are used to illustrate the movement of data between different processes or systems. They show how data enters a process, how it is processed or transformed, and how it then flows out to other processes or systems. Data flow diagrams are often used in system analysis and design to help identify bottlenecks or inefficiencies in data processing and to propose improvements.
4. Decision-making Diagram: Decision-making diagrams, also known as decision trees or tree diagrams, are used to outline a series of decisions or choices and the potential outcomes that result from each decision. This type of diagram is especially useful in decision-making processes where there are multiple options or paths to consider. Decision-making diagrams can be created using flowchart symbols and connecting the different decision points with lines or arrows.
When building a workflow diagram, it’s important to use the appropriate symbols and labels to clearly represent each step and decision point. This will help others understand the process and follow the flowchart more easily. It’s also helpful to provide instructions or notes within the diagram to guide others on how to use or navigate the workflow.
Once your workflow diagram is complete, you can export it as a PDF or image file to share with others or include in documentation or presentations. This makes it easier for others to download and view the diagram, even if they don’t have the software or tools you used to create it.
By using workflow diagrams, you can make your processes more understandable and impactful. Whether you’re making a flowchart to outline a specific process, mapping out data flows, or creating decision-making diagrams, utilizing the right diagram type will help enhance your understanding of the workflow and communicate it effectively to others.
Mural makes building flowcharts easier and more impactful
When it comes to creating flowcharts, having a clear structure and following step-by-step instructions is crucial. Mural is a powerful online tool that helps in building flowcharts with ease and making them more impactful.
Mural provides a canvas where you can create and edit flowcharts. It offers various templates and examples to guide you through the process, making it easier to understand and implement. The resizable canvas allows you to outline your workflow, identify decision-making processes, and provide notes and instructions within the chart.
With Mural, you can use sticky notes and text to create different types of flowcharts, such as swimlane diagrams and process charts. The tool enhances the flowchart-making process by offering options for navigation and export. You can easily download your flowchart as an image or a Microsoft Word document to share with others.
One of the most useful features of Mural is its infinite canvas, which allows you to have a limitless workspace. This is particularly helpful when building complex flowcharts that require a lot of space. The tool also provides tags that can be used to categorize and organize your flowcharts for easier navigation.
By using Mural, you can enhance your understanding of different processes and improve your decision-making abilities. The tool makes building flowcharts easier and more impactful, ensuring that your diagrams are clear, concise, and visually appealing.
| Features of Mural for building flowcharts |
|---|
| Various templates and examples |
| Resizable canvas |
| Ability to add notes and instructions |
| Navigation options |
| Export options |
| Infinite canvas |
| Tagging feature |
So, if you’re looking for a tool to make the process of building flowcharts easier and more impactful, Mural is the way to go. Try it out and see the difference it can make in your diagramming process.
Sticky notes text
Sticky notes are a useful tool for building flowcharts. They can enhance the process of creating a flowchart and help you understand the flow and structure of the flowchart more easily. By using sticky notes with text on them, you can provide instructions, identify different steps in the flowchart, and make the mapping of processes more understandable.
There are several options for using sticky notes in flowchart diagramming. One option is to use templates that provide predefined sticky note shapes and structures. These templates can be downloaded and used within diagramming software such as Microsoft Word or Mural. This makes it easier to create flowcharts without making mistakes or having to edit the structure and layout.
Sticky notes are most commonly used in flowcharts to represent decision-making steps or common workflow processes. They can be used to show the navigation and flow between different steps in the process. By using different colors or tags, you can also add data or additional information to the sticky notes, making them more useful and impactful.
When building flowcharts, it’s important to understand the various types of flowchart diagrams and how sticky notes can be used to enhance them. Flowcharts can be created on an infinite canvas or within a resizable canvas. This flexibility allows for the creation of flowcharts of any size or complexity. Sticky notes can be used to create swimlane flowcharts, which organize different steps or processes into lanes or columns.
Overall, sticky notes with text are a valuable tool for building flowcharts. They provide a visual representation of the flow and structure, making it easier to understand and follow the flowchart. By using templates and different types of sticky notes, you can create impactful flowcharts that effectively communicate your process or decision-making steps.
| Step | Instructions |
|---|---|
| 1 | Use a flowchart template or create a blank canvas. |
| 2 | Add sticky notes to represent the various steps or processes. |
| 3 | Use different colors or tags to add additional information to the sticky notes. |
| 4 | Export or save the flowchart when it is complete. |
Mapping and diagramming
Mapping and diagramming are essential tools in the process of building flowcharts. They help visualize and outline the structure of a workflow or flow of data. Microsoft Word offers various options, such as templates and examples, to create flowcharts. Additionally, there are several software programs, like Mural or Microsoft Visio, that make the process of building flowcharts even easier.
When mapping a process, it is important to identify the most common types of diagrams that will be used for decision-making. For example, flowcharts can be used to provide a step-by-step outline of a process or to map out the navigation between various steps. They can also be enhanced by using swimlane diagrams to show the flow of data within different departments or roles.
One of the most impactful aspects of mapping and diagramming is that it makes the understanding of complex processes much easier. A well-designed flowchart can help to identify mistakes or areas of improvement within a process. It also provides a visual representation that aids in the communication of instructions and guidelines for a particular workflow.
When building a flowchart, it is crucial to follow a systematic approach. Start with an outline of the process and then add the necessary symbols and shapes to represent each step. Use sticky notes or text boxes to provide additional notes or explanations. Finally, edit and refine the flowchart to ensure clarity and accuracy.
There are endless possibilities and infinite ways to create a flowchart, but the most important thing is to choose a method that works for your specific needs. Experiment with different templates and options to find what works best for you. And remember, the main purpose of a flowchart is to provide a clear and logical representation of a process, so it should be understandable and easy to follow.
Mapping and diagramming are valuable tools that can greatly enhance the decision-making process within any organization. They help to identify bottlenecks, streamline workflows, and improve overall efficiency. So, whether you are using Microsoft Word, a specialized software program, or drawing on a canvas, flowcharts will be a useful asset in your work.
To get started, you can download flowchart templates or refer to online tutorials and guides. This will provide you with instructions and examples that will facilitate your understanding of how to create impactful flowcharts. Take advantage of the tools and resources available, and you will see the positive impact flowcharting can have on your work.
In summary, mapping and diagramming are essential components in the process of building flowcharts. They provide a visual representation of a workflow or flow of data, making it easier to understand and identify areas of improvement. Various software options and templates are available to assist in creating flowcharts, and following a systematic approach will ensure clarity and accuracy in the final product.
Infinite Resizable Canvas Options
When it comes to building a flowchart, having a resizable canvas is essential. This feature allows you to enhance your flowchart-making process and make it easier to understand and navigate. By using an infinite resizable canvas, you will have the flexibility to create flowcharts of various sizes, depending on the complexity of your workflow or diagramming needs.
With an infinite resizable canvas, you can use it to outline your entire process or focus on a specific step. It makes it easier to identify the different types of flowcharts, such as a decision-making flowchart, a swimlane chart, or a data mapping diagram. The infinite canvas allows you to map out your processes and provide a clear understanding of how data flows and decisions are made.
The infinite resizable canvas is particularly useful when working with larger processes, where it can be challenging to fit everything within a fixed-size canvas. It also allows you to export your flowcharts in different formats, such as Microsoft Word or PDF, to be used in presentations or shared with others. This will have a more impactful impact on your audience, as they can see the entire flowchart without having to zoom in or scroll through multiple pages.
If you’re new to creating flowcharts, using an infinite resizable canvas can help you avoid common mistakes and understand the structure of a flowchart better. You can use templates and examples as a guide to building your flowchart, adding notes or instructions along the way. This feature makes it easier to identify and correct any errors in your flowchart, improving its accuracy and clarity.
There are various tools and software available that provide infinite resizable canvas options, such as Mural or Microsoft Visio. These tools offer different navigation and drawing options, making it easier to create and edit flowcharts. Some tools also provide pre-designed templates with tags and sticky notes, making it even easier to use.
Overall, utilizing an infinite resizable canvas can significantly enhance your flowchart building process. It allows for flexibility and creativity, making it easier to create impactful and understandable flowcharts. So, when creating your next flowchart, consider using an infinite resizable canvas option to streamline your workflow and improve decision-making.
Tags on sticky notes
Sticky notes are a common tool used in the process of making flowcharts. They are resizable notes that can be added to a canvas to help outline and structure the flowchart. Each sticky note can contain text or data that is helpful for understanding the flow of processes.
Sticky notes can be used in various ways to enhance the flowchart building process. For example, they can be used to identify different steps or instructions, provide examples or templates, or even act as decision-making tags. By using sticky notes in your flowchart, you can make the diagramming process easier to understand and navigate.
There are several types of sticky notes that can be used within a flowchart:
- Process tags: These sticky notes are used to outline the different steps or processes within a flowchart. They help provide a structured flow and make it easier to follow the flowchart.
- Decision tags: These sticky notes are used to indicate decision points in a flowchart. They help identify where different paths or options can be taken based on certain conditions.
- Mapping tags: These sticky notes are used to map out the flow of data or information within a flowchart. They help show how information moves between different steps or processes.
- Navigation tags: These sticky notes are used to provide instructions on how to navigate through the flowchart. They can be used to indicate where to start, where to go next, and how to reach the end of the flowchart.
By using tags on sticky notes, you can create a more impactful and understandable flowchart. This allows others to easily follow the flowchart and understand the processes or decisions being made. Sticky notes make the process of building a flowchart more visual and interactive, making it easier to collaborate and make changes as needed.
Sticky notes can be used in various tools for building flowcharts, such as Microsoft Flow, Mural, or even within Microsoft Word. These tools provide different options and templates for creating flowcharts with sticky notes. Some tools also allow you to export or download the flowchart as a resizable canvas, making it easier to edit and share.
When using sticky notes in your flowchart, it’s important to avoid common mistakes. One of the most common mistakes is using too many sticky notes, which can make the flowchart cluttered and confusing. It’s important to strike a balance between providing enough information and not overwhelming the viewer.
In summary, tags on sticky notes are a useful tool in building flowcharts. They help enhance the understanding and structure of the flowchart by providing visual cues and instructions. By using different types of sticky notes, you can identify different steps, decisions, data mapping, and navigation within the flowchart. Remember to avoid common mistakes and use sticky notes strategically to create an effective flowchart.
Outline navigation instructions
When building flowcharts, it is important to have a clear structure and understand how to navigate within the diagram. In this tutorial, we will provide step-by-step instructions on how to create, edit, and navigate flowcharts using Microsoft Word and other tools.
1. Identify the processes: Before drawing your flowchart, it is essential to identify the processes or steps that need to be represented. This will help you understand the flow and structure of your workflow.
2. Use templates: To make the building process easier, you can use flowchart templates, which are readily available in Microsoft Word and other diagramming tools. These templates provide common flowchart structures and types, making it easier to map out your process.
3. Mapping the flow: Once you have identified the processes and chosen the template, you can start mapping out the flow of your workflow. Use different shapes and symbols to represent each step and the decisions made within the process.
4. Make your flowchart resizable: To enhance the usability of your flowchart, make sure it is resizable. This will allow you to adjust the size of the flowchart within your canvas, making it easier to view and understand.
5. Add notes and data: If necessary, you can add notes and data within the flowchart to provide more context or information about specific steps. These notes can be helpful for others who need to understand your flowchart.
6. Include sticky notes: Sticky notes are a useful tool for making annotations and providing additional instructions or explanations within your flowchart. They can be used to highlight important points and clarify any potential confusion.
7. Use swimlane diagrams: Swimlane diagrams can be used to represent different departments, teams, or individuals involved in the workflow. This helps to illustrate the flow of tasks and responsibilities within a process.
8. Export and share: Once your flowchart is complete, you can export it to various formats, such as PDF or image files, to share with others. This will allow them to view and understand your flowchart without having to edit the original file.
By following these instructions and using the right tools, you can create clear and impactful flowcharts that will guide decision-making and enhance the understanding of complex processes.
For more examples and downloadable flowchart templates, you can explore various resources online. These will provide you with more options and ideas for making your flowcharts more engaging and informative.
Export
Exporting your flowchart is a crucial step in the diagramming process, as it allows you to share and communicate your work with others. There are several important points to note on exporting flowcharts.
1. Use a resizable canvas: When building your flowchart, it is essential to use a canvas that can be resized to accommodate your entire diagram. This ensures that all elements and connections are visible and can be easily understood.
2. Choose the right file format: When exporting your flowchart, you have various options for file formats. The most common ones include PDF, PNG, and SVG. Consider the purpose of exporting and the tools your audience will use to view the diagram, as this will impact the choice of file format.
3. Include helpful tags and notes: To enhance understanding and navigation, it is useful to include tags or notes within your flowchart. These can be used to provide instructions or highlight important processes or decision-making points. They help identify different sections and make it easier for others to navigate through the diagram.
4. Provide clear instructions: When exporting a flowchart, it is essential to provide clear instructions on how to interpret the diagram. This can be done through a separate document or within the flowchart itself, using symbols or a legend to explain the meaning of various shapes and connectors.
Exporting your flowchart can be done using various tools. Microsoft Word and PowerPoint offer options to export diagrams created within their applications. Additionally, there are numerous online diagramming tools and software, such as Mural or Lucidchart, that provide the ability to export flowcharts in different formats.
By following these steps and using the right export options, you can ensure that your flowchart is easily accessible and understandable to others, ultimately enhancing collaboration and decision-making processes.
When to use a flowchart
Flowcharts are efficient tools that can be used to visualize and understand complex processes or workflows. They provide a step-by-step diagramming of a process, making it easier to identify the flow of data and the decision-making options within a system.
Flowcharts are useful in various scenarios, such as:
- Process mapping: Flowcharts can be used to outline the structure and flow of a workflow or process. They help in understanding the different steps involved and the connections between them.
- Instructions: Flowcharts can be used to provide step-by-step instructions for a specific task or process. They are helpful in guiding users through complex procedures and ensuring that all necessary steps are followed.
- Decision-making: Flowcharts are commonly used to illustrate different decision points within a process. By mapping out the options and outcomes, flowcharts can assist in making more informed choices.
- Data visualization: Flowcharts can be used to represent data in a visual and easy-to-understand format. They make it possible to see patterns, relationships, and dependencies between different elements.
Depending on the specific use case, there are different types of flowcharts available, such as swimlane flowcharts, which divide the process into different lanes or categories. This makes it easier to understand the flow of tasks between individuals or departments.
Building a flowchart can be done using various tools and software. For example, Microsoft Word and Mural offer easy-to-use flowchart templates that can be customized to fit your specific needs. Additionally, there are online platforms that allow you to create and edit flowcharts, and even provide resizable canvas options for enhanced flexibility.
By using flowcharts, you can make your processes more efficient and error-free. They serve as a visual guide that can help in avoiding common mistakes and providing a better understanding of the workflow or process at hand.
In conclusion, flowcharts are a powerful tool to enhance the clarity and understanding of complex processes. Whether you are mapping out a workflow, providing instructions, making decisions, or visualizing data, flowcharts are a valuable asset that can greatly impact your work.