
Flowcharts are a visual representation of a series of steps or processes. They are commonly used in programming and other fields to illustrate the logic and flow of a process. Flowcharts are defined by using different shapes and arrows to represent specific steps and their sequence. In this tutorial, we will guide you on how to draw an algorithm flowchart using the TikZ package in LaTeX. This will help you create proper flowcharts that present your processes in a clear and explicit manner.
To start, you will need to have TikZ installed and configured in your LaTeX environment. If you have not installed TikZ yet, you can follow the instructions in the “Getting Started” section of the TikZ manual. Once TikZ is set up, you can begin drawing your flowchart.
First, you need to define the shape and type of each element in your flowchart. This can be done by using the “node” command in TikZ. For example, to create a process symbol, you can use the following code:
ode [rectangle, draw, fill=blue!20, text width=2cm, text centered, minimum height=1cm] (process) {Process};
In the code above, “rectangle” specifies the shape of the node, “draw” adds a border around the node, “fill=blue!20” sets the fill color to a light blue, “text width=2cm” defines the width of the node’s text, “text centered” centers the text horizontally, and “minimum height=1cm” sets the minimum height of the node. The name of the node is specified as “(process)”, which can be used later to reference this node.
Once you have defined the nodes, you can connect them using arrows to represent the flow of the algorithm. For example, to connect two nodes with a directed arrow, you can use the following code:
\draw [->] (node1) -- (node2);
In the code above, “->” specifies that the arrow should be directed, and “(node1)” and “(node2)” indicate the coordinates of the starting and ending points of the arrow. You can use the names of the nodes you defined previously as the coordinates.
In addition to shapes and arrows, you can also add text and color to your flowchart to make it more explicit and visually appealing. For example, you can use the “\emph{fill=green!20}” command to fill a specific shape with a light green color, or the “\emph{draw}” command to draw the outline of a shape.
The TikZ package provides a wide range of options and tools to customize your flowchart, including positioning elements, wrapping text, and using icons or images. In the following section, we will present some examples to help you get started with creating your own flowcharts using TikZ.
Flowchart Tutorial with Symbols Guide and Examples
In this tutorial, we will learn how to create flowcharts using symbols and examples. Flowcharts are diagrammatic representations of algorithms and processes. They help in understanding the flow and order of steps in a process, making it easier to analyze and debug errors in programming code.
Flowcharts are created by using different symbols to represent each step in the process. These symbols are then connected with arrows to show the flow between them. In order to draw a flowchart, we need to start by defining the process and the steps involved in it. We then use the symbols to represent these steps and connect them in the order they should be followed.
There are common symbols used in flowcharts. One such symbol is the “Process” symbol, which represents a specific action or process performed. Another symbol is the “Decision” symbol, which is used to present a choice or condition that needs to be evaluated. Other symbols include “Start” and “End,” which represent the starting and ending points of the flowchart.
To draw flowcharts, we can use different tools such as Microsoft Word, PowerPoint’s SmartArt, or online tools like TikZ. These tools provide predefined shapes and connectors that can be used to create flowcharts. We can also use explicit code to draw flowcharts by specifying the coordinates of each symbol and connecting them in the proper order.
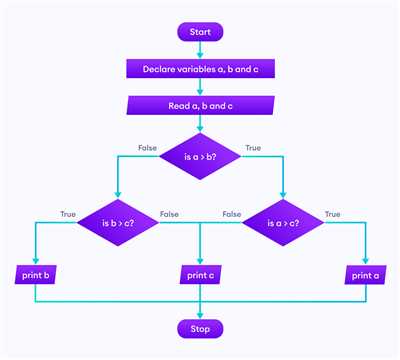
Let’s look at a simple example to understand how to draw a flowchart. We will create a flowchart to show the process of making a cup of tea:
1. Start: We begin the flowchart with the “Start” symbol.
2. Process: We use the “Process” symbol to represent each step involved in making tea, such as boiling water and adding tea leaves.
3. Decision: We use the “Decision” symbol to represent choices, such as whether to add sugar or not.
4. Connectors: We use arrows as connectors to show the flow between symbols.
5. End: We end the flowchart with the “End” symbol.
By following these steps and using the appropriate symbols, we can create a flowchart that visually represents the process of making a cup of tea. This flowchart can be used to show the steps to someone else or to analyze the process and identify any potential errors.
In addition to the symbols, we can also add text, icons, and images to our flowchart to make it more descriptive and interactive. For example, we can add a picture of a teapot or a kettle to represent the boiling water process. We can also insert a text box to provide additional information or explanations for each step.
Flowcharts are a useful tool in programming and other fields where processes and algorithms need to be defined and analyzed. By wrapping complex steps inside a simple and understandable diagram, flowcharts make it easier to understand and follow the flow of a process.
Now that you have a better understanding of flowchart symbols, go ahead and start creating your own flowcharts for various processes! Remember to use the appropriate symbols and connectors to accurately represent the flow of steps in your process.
Start with a proper name

When creating a flowchart, it is important to start with a proper name that accurately reflects the flow you are trying to represent. The name should be clear and concise, giving the reader a good understanding of what the flowchart is about.
Flowcharts are a visual representation of a process or algorithm, so the name should reflect that. It should be something that wraps up the main idea or purpose of the flowchart in a few words.
For example, if you are drawing a flowchart to present a diagram of a simple algorithm, you can start by filling in the name “Algorithm Flowchart”. This will help you stay focused on the specific topic.
When using a flowchart drawing tool, such as Microsoft Visio, you can insert flowchart symbols and connectors to represent different processes and decisions in your flowchart. The connectors, like arrows, will help you clearly define the flow of your algorithm.
When starting to draw your flowchart, choose a tool that explicitly provides a crosshair and coordinates guide. This will help you position your flowchart elements accurately.
Follow these steps to draw your flowchart:
- Start by clicking on the required shape icon in the flowchart drawing tool.
- Draw the shape by clicking and dragging.
- Position the shape using the coordinates defined by the crosshair and guide.
- Fill in the shape with a color. For example, you can use the fill: blue20 color code to make the shape stand out.
- If needed, add text to the shape by clicking inside it and typing your content.
- Connect the shapes using connectors. Click and drag from one shape to another to create the connectors.
- Create flowchart symbols for decision points by using the “decision” shape icon. This will help you show different paths in your flowchart.
By following these steps, you can easily create a flowchart that is visually appealing and easy to understand. Start with a proper name, draw the elements in the correct order, and connect them using arrows or connectors. This will help guide your audience through the flowchart and make your flowchart a success.
How To Make A Flowchart In Word
If you want to create a proper and well-defined flowchart, you can use Microsoft Word to draw it. Word provides various shapes and tools that you can use to create a flowchart for your algorithms or processes. In this tutorial, we will guide you on how to create a flowchart in Word using the drawing tool and SmartArt.
To start creating a flowchart in Word, follow the steps presented below:
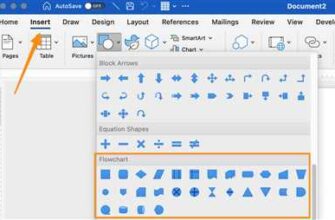
- Open Microsoft Word and click on the Insert tab in the top menu.
- Click on the Shapes icon in the Illustrations section.
- Choose a shape that represents the first step or process of your flowchart. Common symbols used in flowcharts include rectangles for processes, diamonds for decisions, and arrows for connectors.
- Click and drag the shape to the desired position on the page. You can use the gridlines or coordinates to help you position the shape.
- Name the shape or add text to describe the step or process.
- To add more steps or processes, repeat steps 3 to 5. You can also connect the shapes using lines or arrows to show the flow of the algorithm or process.
- Fill the shapes with color to make them stand out. You can choose different colors to represent success, failure, or specific conditions.
- You can also add icons or images inside the shapes to make the flowchart more visually appealing. Simply click on the shape and click on the Insert icon to add an image or icon.
- If you prefer using SmartArt to create your flowchart, click on the Insert tab, then click on the SmartArt icon. Choose a SmartArt graphic that suits your needs, such as a Process or Cycle diagram.
- Follow the instructions to input your specific text and data into the SmartArt graphic.
- To create explicit connectors, click on the shape or element, then click on the Format tab. In the Shape Styles group, click on the desired connector style.
- If you need to reposition the shapes or connectors, click and drag them to a different position. You can also resize them by clicking and dragging the handles.
- To wrap text or adjust the spacing around the shapes, right-click on the shape and select the Wrap Text option. Choose the desired wrapping style from the menu.
- Once you have completed your flowchart, save it and share it with others.
By following this step-by-step guide, you can easily create a flowchart in Word to visually represent your algorithms or processes. Whether you prefer using the drawing tool or SmartArt, Word provides the necessary tools to create professional-looking flowcharts.
1 Using Shapes
When creating algorithm flowcharts, it is common to use shapes to represent different elements of the chart. These shapes allow you to visually distinguish between different processes, symbols, and connectors within the flowchart.
One popular tool for creating algorithm flowcharts is TikZ, an explicit picture drawing tool in LaTeX. With TikZ, you can define the shapes and colors of the elements in your flowchart, and specify the positioning of each element. This tutorial will guide you through the process of creating a flowchart using TikZ.
To start, you will need to have TikZ installed. If you are using a LaTeX environment, TikZ is usually already included. If not, you can download it from the official TikZ website.
Once you have TikZ installed, you can begin creating your flowchart. The first step is to define the shapes and colors you want to use. For example, you can create a rectangle shape for process symbols and fill it with a specific color, such as fill=green!20.
Next, you can start placing the symbols inside the flowchart by specifying their coordinates. For example, to place a process symbol at coordinates (4, 1), you can use the following code:
ode [rectangle, draw=none, fill=green!20] (process) at (4, 1) {Process}. This will create a rectangle shape with a green fill and no border, and place the text “Process” inside it at the specified coordinates.
To connect the different symbols in your flowchart, you can use arrows. For example, to connect a starting symbol to a process symbol, you can use the following code: \draw [->] (start) — (process). This will create an arrow between the “start” symbol and the “process” symbol.
You can also add modifiers to the shapes to further customize their appearance. For example, you can use the error modifier to create an error symbol, or the success modifier to create a success symbol. These modifiers can be placed inside the shape’s options, such as
ode [rectangle, draw=none, fill=red!20, error] (error) at (8, 2) {Error}.
When drawing your flowchart, it is important to follow a specific order to make sure the elements are properly connected. For example, you should first insert the starting symbol, then the process symbols, and finally the ending symbol. This will ensure that the flow of the chart is logical and easy to understand.
In conclusion, when creating algorithm flowcharts, using shapes can help make the flowchart more visually appealing and easier to understand. TikZ is a powerful tool that allows you to create flowcharts with different symbols, colors, and connections. By following a step-by-step approach, you can easily create a professional-looking flowchart for your algorithm or programming code.
Sources:
- https://tikz.de/
- https://www.latex-project.org/
- https://www.overleaf.com/learn/latex/TikZ_package
2 Using SmartArt
In order to create an algorithm flowchart using SmartArt in Microsoft Word, follow the steps below:
- Start by clicking on the “Insert” tab in the top menu.
- Then, click on the “SmartArt” button in the “Illustrations” section.
- A gallery of common SmartArt diagrams will appear. Choose the diagram that best represents the flow of your algorithm. For example, a process flow or a cycle diagram can be used.
- Once you have selected a SmartArt diagram, a text pane will appear on the left side of the screen. Fill in the process steps or symbols that you want to include in your flowchart.
- If you need to add more shapes or connectors, simply click on the plus or minus signs within the text pane.
- To modify the position or order of the shapes, click on the shape you want to move and then use the arrow keys or the positioning options in the SmartArt Tools Format tab.
- If you want to change the color of the shapes, click on the one you want to modify and then use the fill options in the SmartArt Tools Format tab. For example, you can choose the “Fill” button and select “Fill Blue 20” to give it a blue color.
- To add images or additional text to your flowchart, simply click on the shape and then use the options in the SmartArt Tools Format tab.
- If you want to add a specific shape that is not present in the SmartArt gallery, you can create a custom shape using the Drawing Tools modifier. Click on the “Insert Shapes” button and choose the type of shape you need. Then, click and drag on the canvas to draw the shape. You can also modify its size and position by clicking and dragging the points or using the Picture Tools Format tab.
- Finally, once you have finished drawing your flowchart, you can save it or share it as an image or PDF. Click on the “File” tab, then choose “Save As” and select your desired format.
By following this tutorial, you can easily create algorithm flowcharts using SmartArt in Microsoft Word. Using SmartArt allows you to draw flowcharts with a variety of different shapes, connectors, and symbols. It provides an explicit and visually appealing way to represent the flow of your algorithm.
Simple Flowcharts Examples
Flowcharts are a common tool used in programming and other fields to visually represent processes. They are used to illustrate the steps and decision points in a workflow, making it easier to understand and follow. In this article, we will explore some simple examples of flowcharts and learn how to create them using different tools and symbols.
1. Using Microsoft Word:
Microsoft Word provides a simple and easy way to create flowcharts using its built-in SmartArt feature. To create a flowchart in Microsoft Word, follow these steps:
- Open Microsoft Word and click on the “Insert” tab in the ribbon.
- Click on the “SmartArt” icon in the “Illustrations” section.
- In the “Choose a SmartArt Graphic” window, click on “Process” in the left panel.
- Choose the flowchart layout you prefer by clicking on it.
- Click on the placeholders inside the SmartArt graphic to enter the text for each step or decision point.
- Modify the flowchart elements by clicking on the appropriate icon in the SmartArt Tools toolbar.
- Right-click on any element to add or delete nodes, change the symbol type, or modify the formatting.
- Click on the “Design” tab in the ribbon to change the color, shape, or layout of the flowchart.
- Once your flowchart is complete, click on the “Insert” tab and choose “Picture” to save it as an image file.
2. Using TikZ:
TikZ is a popular LaTeX package for creating high-quality graphics. It provides a specific set of commands for drawing flowcharts and other diagrams. To create a flowchart using TikZ, follow these steps:
- Start a new LaTeX document and add the TikZ package to the preamble.
- Define the starting position of the flowchart using the TikZ “tikzpicture” environment and the “crosshair” modifier.
- Define the flowchart elements by using the TikZ “node” command and specifying the shape and text of each element.
- Connect the flowchart elements using the TikZ “draw” command and specifying the starting and ending coordinates of each arrow.
- Fill the flowchart elements with color using the TikZ “fill” modifier and specifying the desired color code.
- Explicitly define the order of the flowchart elements using the TikZ “positioning” library and the “right of” or “below of” commands.
- Insert decision points in the flowchart using the TikZ “diamond” symbol.
- Fill the decision points with color using the TikZ “fill=green!20” command.
- Add explanatory text or comments using the TikZ “node” command with the “text width” modifier.
These examples provide a simple guide on how to create flowcharts using different tools and symbols. By following these steps and using the proper techniques, you can easily draw your own flowcharts to represent any process or workflow.
41 Creating Flowcharts With Explicit Coordinates
When it comes to drawing algorithms or flowcharts, there are various tools available that make the process easier. One such tool is the algorithm flowchart creator, which allows you to visually represent the steps of an algorithm in a graphical format. In this article, we will explore how you can create flowcharts with explicit coordinates using a specific example.
Let’s consider Example 41 in the programming environment. To draw a flowchart for this example, you can start by choosing the appropriate flowchart shape for each step. You can use the “Start” symbol to mark the beginning of the flowchart and the “End” symbol to mark the end. Additionally, you can use different shapes and symbols to represent specific actions or decisions.
To create the flowchart with explicit coordinates, follow these steps:
- Open the algorithm flowchart creator.
- Create a new flowchart.
- Choose the “Start” symbol from the flowchart shapes.
- Position the “Start” symbol at the top of the flowchart.
- Insert the name of the algorithm or flow inside the “Start” symbol.
- Fill the “Start” symbol with a green color.
- Choose the “Process” symbol from the flowchart shapes.
- Position the “Process” symbol below the “Start” symbol.
- Insert the code or action that the “Process” symbol represents.
- Repeat steps 7-9 for each step of the flowchart. Each step should be positioned below the previous one.
- Connect the different symbols using connectors or arrows to indicate the flow of the algorithm.
- Follow the specific algorithm or flow to create the flowchart.
- Use the “Decision” symbol for any decision-making points in the flowchart.
- Fill the “Decision” symbol with an appropriate color to indicate the decision.
- Use the “End” symbol to mark the end of the flowchart.
By following these steps and explicitly positioning each symbol, you can create a clear and concise flowchart that accurately represents the algorithm or flow. This explicit coordination allows for better understanding and troubleshooting of the flowchart.
Flowcharts with explicit coordinates are also useful when you need to share your flowchart with others or insert it into a larger document, such as a Word document. By using explicit coordinates, you can ensure the correct positioning of the flowchart within the document.
In the next section, we will explore Example 42, which will further demonstrate the use of explicit coordinates in creating flowcharts.
42 Creating Flowcharts With Relative Positioning
Flowcharts are a common and helpful way to visualize processes and algorithms. In this tutorial, we will show you how to create flowcharts using a simple yet powerful tool called TikZ. TikZ is a programming language for drawing diagrams and flowcharts in LaTeX.
Flowcharts consist of different shapes and symbols that are connected with arrows to represent the flow of the process. To start drawing a flowchart, you need to define the shapes and symbols you will be using. This can be done by inserting the following code at the beginning of your TikZ picture:
�kzlibrary{shapes.geometric}
\tikzset{
startstop/.style={rectangle, rounded corners, minimum width=3cm, minimum height=1cm,text centered, draw=black, fill=fillblue20},
process/.style={rectangle, minimum width=3cm, minimum height=1cm, text centered, draw=black, fill=fillgreen20},
decision/.style={diamond, minimum width=3cm, minimum height=1cm, text centered, draw=black, fill=fillgreen20},
arrow/.style={thick,->,>=stealth}
}
In this example, the shapes defined are a rectangle with rounded corners for the start and stop symbol (startstop), a plain rectangle for the process symbol (process), and a diamond shape for the decision symbol (decision). You can insert any shape you need for your flowchart by modifying or adding new shapes in the code.
Once the shapes are defined, you can start positioning them on the flowchart canvas. In TikZ, you can use relative positioning to place shapes inside or next to each other. The syntax for relative positioning is as follows:
ode [shape, below=of othernode] (newnode) {Text};
In the above code, “shape” is the name of the shape you want to position, “othernode” is the name of a previously defined node that you want to position the new node below, and “newnode” is the name you give to the new node. You can also specify other relative positions such as “above”, “right”, or “left” instead of “below”.
To connect the shapes with arrows, you can use the arrow style defined previously. Use the following code to connect two shapes:
\draw [arrow] (node1) -- (node2);
In the code, “node1” and “node2” are the names of the shapes you want to connect. You can also add labels to the arrows for a more detailed flowchart or to show specific conditions using the following code:
\draw [arrow] (node1) -- (node2) node[midway, above] {Label};
In this code, “Label” is the text you want to display as a label on the arrow, and “midway” is a modifier that positions the label in the middle of the arrow.
With this information, you can start drawing your own flowcharts using TikZ. The previous sections presented the most common and simple techniques for creating flowcharts. However, TikZ offers many more features and options that can help you create more complex and visually appealing flowcharts. The TikZ manual and online resources are great sources for learning more about TikZ and exploring its capabilities.
Wrapping up
In this tutorial, we have covered the entire process of creating algorithm flowcharts. We started by exploring the importance of flowcharts in programming and how they help us visualize the flow of our code.
We then went on to discuss the different symbols and connectors used in flowcharts, including the terminator, process, decision, and input/output symbols. We also learned how to insert text and connect different elements using arrows.
We explored two common tools that can be used to create flowcharts: Microsoft Word’s SmartArt and the TikZ package in LaTeX. We saw examples of how these tools can be used to draw simple flowcharts.
It is important to note that in both tools, the positioning of elements can be explicitly defined using coordinates. This allows us to place elements relative to each other in a specific order.
In the examples we shared, we used the modifier “draw=none” to remove the outline of the shapes. However, you can modify the appearance of the elements by explicitly setting their fill and color properties.
To create flowcharts in a programming environment, we can use a tool like NodeDraw. With this tool, we can define the elements and their properties using code. This makes it easy to create complex flowcharts and also allows for easy modification if there is an error or a change in the process.
In conclusion, flowcharts are a valuable tool for visualizing algorithms and programming processes. They make it easier to understand and communicate complex ideas. Whether you are using a simple diagram or a more complex flowchart, following the right symbols and connectors can help you create a clear and explicit representation of your code.
| Symbol | Type | Word |
|---|---|---|
| Terminator | Starting/Ending | Success |
| Process | Action/Operation | Make |
| Decision | Question/Condition | Follow |
| Input/Output | Data | Insert |
By explicitly defining the fill and color properties, we can add visual interest to our flowcharts. For example, we can give the process elements a fill of green (fill=green!20) and the decision elements a fill of blue (fill=blue!20).
In the previously mentioned flowchart examples, we used connectors to show the flow between different elements. These connectors can be represented by arrows or simply by lines. In the NodeDraw tool, we can use the “crosshair” modifier to draw them.
We hope that this tutorial has provided you with a comprehensive guide to drawing algorithm flowcharts. Whether you choose to use a simple diagram or a more complex flowchart, the key is to use the right symbols and connectors to communicate your code’s flow effectively.