
Flowcharts are a valuable tool for visualizing processes and workflows. Whether you’re a project manager, a team leader, or a business owner, knowing how to create a flowchart can help you improve efficiency and understand complex processes. In this article, we will guide you through the process of preparing a flowchart without the need for major software or unfamiliar tools.
Step 1: Determine the purpose of your flowchart. Before you start creating your flowchart, it’s important to understand why you need one. Are you trying to document a process, map out a project plan, or review organizational procedures? Defining the purpose will help you determine the right approach and direction for your flowchart.
Step 2: Identify the components and steps involved in the process. Write down all the different components, functions, and steps that are part of the process you want to visualize. This will help you in the next step when you start placing the shapes and symbols on your chart.
Step 3: Select the right symbols and shapes. There are standard symbols and shapes that are commonly used in flowcharts. These symbols represent different actions or decisions that occur in a process. Open your flowchart maker or software and use the appropriate symbols to represent the actions and decisions in your process. You can resize, rotate, or delete symbols to fit your needs.
Step 4: Connect the symbols with arrows. Once you have placed the symbols, it’s time to connect them with arrows to show the flow and sequence of the process. Use connectors to join the different shapes and draw arrows to indicate the direction of the process. Make sure the arrows are easily understandable, and review the flowchart to ensure it accurately represents the process you described.
Step 5: Customize and publish your flowchart. After you have developed your flowchart, you can further improve its clarity and visual appeal by customizing the colors, fonts, and styles. Additionally, you can include a brief description or FAQ section to provide more context or help for the reader. Finally, publish your flowchart in a format that is easily accessible and shareable.
By following these tips and steps, you can create a flowchart that helps you and your team better understand the processes and workflows in your organization. Flowcharts give you a visual representation of your process, making it easier to identify bottlenecks, improve efficiency, and determine whether there are any gaps or areas for improvement. So, next time you’re faced with a complex process, open your flowchart maker and start mapping it out!
- How to Make a Flowchart
- How to make a flowchart in 5 steps
- Step 1 – Determine The Purpose Or Function
- Step 2 – Map out major steps using flowchart symbols
- Step 3 – Place The Components In Order
- Step 4 – Review & Improve The Flowchart
- Step 5 – Publish & Share Your Flowchart
- Move, Resize, Rotate, and Delete Shapes
- When to use a flowchart
- FAQ
- Sources
How to Make a Flowchart
A flowchart is a visual representation of a process or workflow. It is a simple and easy way to map out the steps and paths of a project or process. Flowcharts use different shapes and symbols to represent each step, function, or decision, making it easy to understand and follow. In this article, we will go over the steps to create a flowchart and provide some recommendations to make it more efficient and effective.
- Determine the purpose: Before you start creating a flowchart, determine the purpose of the document. Is it to document a process, develop a new one, or review an existing one? Understanding the purpose will help you choose the right approach and design for your flowchart.
- Gather information: Collect all the necessary information about the process or project you want to map. This could include the steps involved, decision points, inputs, and outputs. Consult with your team or subject matter experts to ensure you have a thorough understanding of the process.
- Choose the right symbols and shapes: Use standard flowchart symbols and shapes to represent different functions and processes. Common symbols include rectangles for processes, diamonds for decisions, arrows for flow, and rounded rectangles for start and end points. You can also use special symbols to represent specific actions or functions within the process.
- Map out the flow: Start with a brief overview of the entire process and then dive into the details, step-by-step. Use arrows to show the direction of flow between different steps and decision points. Make sure to use the appropriate symbols and shapes to represent each step and decision.
- Review and refine: After creating the initial flowchart, review it for any inefficiencies or areas that need improvement. Review it with your team or subject matter experts to gather feedback and make necessary changes. Make sure the flowchart accurately represents the process and is easy to understand.
- Open a flowchart software or use a manual approach: There are many flowchart software available that make it easy to design and create flowcharts. Some popular choices include Microsoft Visio, Lucidchart, and draw.io. These software provide a wide range of shapes, symbols, and functionalities to develop professional-looking flowcharts. Alternatively, you can also create a flowchart manually using a pen and paper or any drawing tool.
- Use the software functionalities: If you choose to use flowchart software, take advantage of its functionalities to enhance your flowchart. You can resize, delete, or move shapes, connect them with arrows, and even rotate them if needed. This will help you create a clean and visually appealing flowchart.
- Share and publish: Once you have created the flowchart, share it with your team or relevant stakeholders for their review and feedback. You can either share it as a document or use collaborative features within the flowchart software to allow others to view and make comments. If necessary, publish the flowchart in a project or process documentation for future reference.
By following these tips and recommendations, you can easily create a flowchart to visualize and communicate complex processes or workflows. Flowcharts are a powerful tool to understand the flow of a project or process, identify inefficiencies, and plan for improvements.
How to make a flowchart in 5 steps
Creating a flowchart is an effective way to visually represent a process or workflow. It helps to identify inefficiencies, improve communication, and document a plan. Whether you’re a project manager, team leader, or simply want to organize your thoughts, follow these 5 steps to make a flowchart:
Step 1: Determine the purpose and scope of your flowchart.
Decide what process or workflow you want to document. Identify the key functions and steps involved. This will help you draw the flowchart in the right order.
Step 2: Gather the necessary information.
Collect all the information you need to create the flowchart. This can include steps, decisions, inputs, outputs, and any other relevant details. Use different shapes and symbols to represent each element.
Step 3: Design your flowchart.
Start by drawing a circle or rectangle to represent the start and end points of the process. Use arrows to indicate the direction of flow. Draw the steps and decisions using appropriate symbols. Use connectors to link the steps together.
Step 4: Map the entire process.
Once you have drawn the individual steps, connect them in the correct order to create a complete process flowchart. Ensure that there are no gaps or inconsistencies between the steps. This will give you a visual representation of the entire process.
Step 5: Review and optimize.
Review your flowchart for any errors, inefficiencies, or areas that can be improved. Seek feedback from your team or colleagues to ensure accuracy. Make necessary adjustments and recommendations. Move and resize the shapes as needed to create a more organized and easy-to-follow flowchart.
By following these 5 steps, you can create an effective flowchart to visually represent any process or workflow. Flowcharts help to streamline communication, identify bottlenecks, and improve overall efficiency. Whether you’re a beginner or an experienced flowchart maker, this step-by-step approach will help you design flowcharts with ease.
Step 1 – Determine The Purpose Or Function
Before you start creating a flowchart, it’s important to determine the major purpose or function that you want to achieve. The purpose of a flowchart is to visually represent a process or a series of steps in order to make it easier to understand and follow.
Ask yourself why you need a flowchart. Is it to map out a complex project? Is it to help your team understand a new process? Is it to identify inefficiencies in your current processes and improve them?
Determining the purpose of your flowchart will help you decide how to approach creating it. If you’re unfamiliar with flowcharts or the subject of the flowchart, you may need to start from scratch and gather information from team members or management to fully understand the process. On the other hand, if you’re familiar with the process, you can make use of a standard flowchart symbol and shape set to create it more quickly.
When determining the purpose or function of the flowchart, it’s also important to consider whether it will be a standalone document or part of a larger project. This will help you decide how detailed and complex the flowchart needs to be. For a simple process, a few basic shapes and symbols may be sufficient. However, for a more complex process, you may need to use additional shapes and symbols to clearly map out all the steps.
One tip when creating a flowchart is to always start by drawing the process from left to right, top to bottom. This is the traditional direction that flowcharts are read and it helps to create a logical flow. If you need to delete or add steps later, it’s easier to do so when the flowchart is built in the right order.
Another tip is to use arrows to represent the direction of the process flow. This helps to clearly indicate the sequence of steps and how they connect with each other. Arrows can be used to show a one-way flow or a loop.
When it comes to software, there are many options available for creating flowcharts. You can use a simple drawing tool like Microsoft Paint or Google Drawings, or you can use specialized flowchart software like Lucidchart or Visio. Using software makes it easier to create, edit, and share your flowchart, and it also gives you the ability to easily rotate shapes and rearrange them as needed.
In conclusion, determining the purpose or function of a flowchart is a crucial first step. This will help you understand the scope of the flowchart and decide on the right approach for creating it. Making use of standard symbols and shapes, following a logical order, and using arrows to indicate the flow will make your flowchart more clear and understandable.
Step 2 – Map out major steps using flowchart symbols
Flowcharts are visual representations of a process or system, making it easier for everyone involved to understand and follow the steps. In this step, you will determine the major steps of your process and use flowchart symbols to map them out.
Flowchart symbols are standardized shapes that represent different components or actions in a process. They help you organize the steps of your process in a logical order and make it easy for others to understand. Below are some tips to help you with this step:
1. Determine the major steps: Start by identifying the major steps or actions involved in your process. For example, if you’re creating a flowchart for a project management process, the major steps might include “determine project scope,” “develop project plan,” and “publish project deliverables.”
2. Use flowchart symbols: Each major step in your process should be represented by a flowchart symbol. The most commonly used symbol is a circle, which represents the start or end of a process. Rectangles are used to represent actions or tasks, while diamonds represent decision points. Arrows are used to connect the symbols and show the flow of the process.
3. Map out the steps: Place the symbols in the order of your process, using arrows to connect them. If necessary, resize the symbols to fit the content inside. You can also rotate the symbols to fit the layout of your flowchart.
4. Share and review: Once you have mapped out the major steps using flowchart symbols, share the flowchart with your team or stakeholders for feedback. This will help you identify any areas that need improvement or clarification.
By following this step, you will be able to visually map out the major steps of your process using flowchart symbols. This simple and visual approach improves understanding and helps ensure that everyone is on the same page when it comes to the process.
Step 3 – Place The Components In Order
Once you have identified and defined the components that make up your flowchart, it’s time to place them in the appropriate order. This step is crucial to ensure that your flowchart is easy to understand and follow.
- Start by determining the first step or process in your flowchart. This will typically be the initial action or task that needs to be completed.
- Next, use connector symbols to indicate the direction and flow between the different components of your flowchart. These symbols will help your team understand how the processes are connected and how they should be followed.
- As you place the components in order, take into account any paths or decision points that may exist. Flowcharts are often used to determine whether a certain action should be taken or whether a certain condition is met. Ensure that these decision points are clearly represented in your flowchart.
- When placing the components, make sure there is enough space between them to clearly see the flow and avoid any confusion. You can resize and rotate the components as needed to fit them into your flowchart.
- If your flowchart is complex with many components, you can consider using shapes or colors to give a visual indication of the different steps or processes. This will improve the overall design and make it easier to understand.
- Review your flowchart after placing the components to ensure that it accurately represents the process or project you are documenting. Seek feedback from your team or subject matter experts to identify any potential improvements or inefficiencies.
To share or publish your flowchart, you can either print it out or use a flowchart maker tool that allows for easy sharing and collaboration. There are many online flowchart maker tools available that provide standard symbols and templates to help you develop professional-looking flowcharts.
In summary, placing the components of your flowchart in the right order is a critical step in creating an effective and understandable visual representation of a process or project. Following these tips will help you create a flowchart without any confusion or errors.
Step 4 – Review & Improve The Flowchart
Once you have created a preliminary flowchart, it is important to review and improve it to ensure its accuracy and clarity. The following steps can help you determine whether your flowchart effectively communicates the process:
1. Review the entire flowchart: Take a look at the flowchart as a whole and ensure that all steps and connections are clear and logical. Make sure that the flowchart follows a clear and consistent direction, from the starting point to the end point.
2. Verify the use of shapes and symbols: Check whether you have used the appropriate shapes and symbols to represent different steps, processes, or functions. Ensure that each shape or symbol is properly labeled and easily understandable.
3. Improve visual clarity: Make sure that the flowchart is easy to read and understand. You can achieve this by using standard flowchart symbols and by following a clear and consistent layout. Consider using color or shading to distinguish different parts of the flowchart.
4. Delete unnecessary steps: Eliminate any steps or processes that are not essential to the flowchart. A flowchart should only include the relevant steps required to complete the process or project, without any unnecessary or redundant information.
5. Make use of arrows and connectors: Use arrows and connectors to show the flow of information or direction between different steps or shapes. This helps to clarify the order in which the steps should be followed and the relationship between them.
6. Resize and rotate shapes: If necessary, resize or rotate shapes to fit them on the flowchart and improve its overall appearance. This can help to create a more visually appealing and organized flowchart.
7. Publish and share the flowchart: Once you have reviewed and improved the flowchart, it is important to publish and share it with others. This can be done by saving the flowchart as a document or image file, or by using flowchart maker software to create an electronic version.
8. Seek feedback and follow recommendations: Ask others to review the flowchart and provide feedback. Their perspective can help you identify any areas that may need further improvement or clarification. Follow their recommendations to enhance the flowchart’s effectiveness.
By following these tips and guidelines, you can create a clear and effective flowchart that helps in understanding and documenting a process or project.
Step 5 – Publish & Share Your Flowchart

Once you have completed your flowchart using the steps outlined above, it is time to publish and share it with others. Sharing your flowchart allows you to communicate your process visually and ensure everyone involved is on the same page.
Here are some tips to help you publish and share your flowchart:
- Determine the purpose: Before sharing your flowchart, determine whether it is intended for internal use within your team or for external stakeholders. This will help you decide how to publish and share it effectively.
- Select the right publishing method: Depending on your audience and the context, there are different ways to publish and share your flowchart. You can choose to create a digital version using flowchart software, or you can print it out and distribute physical copies.
- Review and revise: Before sharing, make sure to review your flowchart for any errors or inefficiencies. Ask someone else to review it as well to get a fresh perspective.
- Use clear and consistent flowchart symbols: When creating your flowchart, use standardized symbols and shapes to represent different components, processes, and steps. This will make it easier for others to understand and follow your flowchart.
- Publish in a visual format: Flowcharts are meant to be visual representations of a process, so it’s important to publish and share them in a format that is easy to understand and follow. You can use software that allows you to create visual flowcharts or create them from scratch using basic drawing tools.
- Resize and rotate: Depending on where you plan to publish your flowchart, you may need to resize or rotate it to fit the desired format. Use appropriate tools and software to make these adjustments.
- Add explanatory notes or a brief document: If your flowchart is complex or if there is any confusion possible, it helps to add explanatory notes or a brief document that provides additional context and explanation for certain steps or components.
- Share with your team: Once your flowchart is ready, share it with your team to gather feedback and ensure everyone is aligned on the process. This will help you identify any gaps or areas that can be improved.
- Publish and distribute: After incorporating feedback from your team, finalize your flowchart and publish it in the desired format. Whether it is an internal collaboration platform, a shared folder, or a physical bulletin board, make sure to distribute it to the relevant audience.
- Open for feedback: Encourage your team and other stakeholders to provide feedback on the flowchart. This will help you continuously improve and refine the flowchart over time.
By following these steps, you can publish and share your flowchart effectively, ensuring that everyone understands and follows the documented process.
Move, Resize, Rotate, and Delete Shapes
When creating a flowchart, one of the key elements is the ability to manipulate shapes and symbols. In this guide, we will walk you through how to move, resize, rotate, and delete shapes within your flowchart.
To draw shapes in your flowchart, you can use a visual document editor or a flowchart maker. Whether you choose a simple online tool or a more complex traditional software, the purpose remains the same – to visually map out your processes.
When it comes to manipulating shapes, there are a few recommendations we give. First, it is important to determine the right place for each shape. Below, we will give you a brief overview of the steps to move, resize, rotate, and delete shapes in your flowchart.
- Move: To move a shape, simply click and drag it to the desired position in your flowchart. This helps you establish the order of your processes and determine the most efficient path.
- Resize: Resizing shapes can be done by clicking and dragging the edges or corners of the shape. This allows you to make the shapes smaller or larger, depending on your requirements.
- Rotate: To rotate a shape, you can often find a rotate handle or an option in the toolbar. Click and drag the handle or input a specific angle to adjust the direction of the shape.
- Delete: If there is a shape that is no longer needed in your flowchart, you can simply select it and press the delete key or use the delete option in the toolbar.
By following these steps, you can easily move, resize, rotate, and delete shapes in your flowchart. This allows you to create a more customized and organized chart that helps your team understand and review the processes.
Additionally, when it comes to connectors or arrows between shapes, you can determine the path without them or use different types of connectors for different purposes. It’s up to you and the requirements of your project.
Remember, a flowchart is a visual representation of a process or plan. By using symbols and shapes to represent each step, you can easily map out the entire process from start to finish. This not only helps with understanding the process but also helps identify any inefficiencies or areas for improvement.
In summary, the ability to move, resize, rotate, and delete shapes in a flowchart is a major component of creating an effective flowchart. It allows you to design a chart that suits your specific needs and makes it easy for your team to understand and follow.
If you have any further questions or need more information, please check out our FAQ section or reach out to our support team for guidance.
When to use a flowchart
A flowchart is a visual representation used to understand and map out the different steps and processes involved in a function, process, or project. It is a simple and easy-to-understand tool that can help in the design, review, and improvement of various organizational processes. Here are 5 common scenarios where you can use a flowchart:
- To understand a process: Flowcharts are useful when you need to understand how a process works, step by step. By following the flowchart, you can easily determine the order in which tasks are performed and identify any inefficiencies or bottlenecks that may be present.
- To document a process: A flowchart can be used to document and visualize a process, making it easier for others to understand and follow. It can serve as a standard visual representation of a process that can be shared and reviewed by different stakeholders.
- To identify improvements: Flowcharts can help in identifying areas for improvement in a process. By visualizing the flow of tasks and activities, you can easily spot any redundancies, unnecessary steps, or inefficiencies and recommend changes or optimizations to streamline the process.
- To communicate and share: Flowcharts provide a common language that can be easily understood by everyone involved in a project or process. It allows for clear communication and collaboration, making it easier to discuss and share ideas, recommendations, and guidelines.
- To make decisions: Flowcharts can be used as decision-making tools. By mapping out different paths and outcomes, you can visually analyze the pros and cons of each option and make informed decisions based on the flowchart.
In summary, flowcharts are a powerful and versatile tool that can be used in a variety of situations. Whether you’re looking to understand a process, improve an existing one, document a procedure, or make decisions, a flowchart can provide clarity and structure to your thoughts and actions.
FAQ
Here are some frequently asked questions about flowcharts:
- What is a flowchart?
- How do I create a flowchart?
- When should I use a flowchart?
- What are the components of a flowchart?
- How do I resize or rotate a shape or connector in a flowchart?
- Can I delete a step or connector in a flowchart?
- Do you recommend using a flowchart template or starting from scratch?
- What tips do you have for creating an effective flowchart?
- Keep the flowchart simple and easy to understand
- Follow a logical order and use connectors to link the steps
- Use standard flowchart symbols and shapes
- Give brief explanations for each step or decision point
- Review and refine your flowchart to eliminate any errors or inefficiencies
- Consider involving your team in the flowchart creation process for their input and feedback
A flowchart is an organizational tool that visually represents the steps or processes in a project or plan. It helps determine the order of operations and identify any inefficiencies or areas for improvement.
There are different approaches to creating a flowchart. You can use a traditional pen and paper and draw it from scratch, or you can use flowchart design software or a flowchart maker tool. It’s important to follow the standard flowchart symbols and components to make it easy to understand and share.
A flowchart can be used in various situations, such as process management, project planning, and decision-making. It comes in handy when you need to visualize and review the entire process or map out the steps in a specific subject.
A flowchart typically consists of different shapes and symbols. The most common ones include rectangles for process steps, diamonds for decision points, circles or ovals for start or end points, and arrows to connect the steps. You can also use connectors to link different parts of the flowchart.
To resize a shape or connector in a flowchart, you can click on it to select it, and then drag the selection handles to make it larger or smaller. To rotate a shape or connector, click on it to select it, then hover the mouse over the rotation handle until the cursor changes to a circular arrow, and then click and drag to rotate it.
Yes, you can delete a step or connector in a flowchart. Simply select the step or connector you want to delete, and press the “Delete” key on your keyboard, or right-click on it and choose the “Delete” option from the context menu.
Whether you should use a flowchart template or start from scratch depends on your preference and the complexity of the process you’re diagramming. Using a template can save time and provide a starting point, while starting from scratch allows for more flexibility and customization.
Here are some tips to create an effective flowchart:
These are some of the frequently asked questions related to flowchart creation. If you have more specific questions, feel free to consult the documentation or user manual of your flowchart software or tool.
Sources

When it comes to preparing a flowchart, there are several sources you can use to help you develop a visual representation of your project or process. These sources can provide you with the necessary symbols and design elements to create an effective flowchart.
1. Manual Drawing and Documentation: One of the most traditional approaches to creating a flowchart is by drawing it manually using basic shapes such as circles, rectangles, and arrows. This method is easy to follow and can be done without any specialized software. You can determine the steps involved in your process and draw them out using the different shapes, arrows, and symbols.
2. Flowchart Maker Software: If you’re unfamiliar with manual drawing or want to create a more complex flowchart, there are many flowchart maker software available that can help you in the process. These software tools provide you with a wide range of shapes, connectors, and symbols that you can use to design your flowchart. They also come with features such as the ability to resize, rotate, and delete shapes, as well as to customize the colors and styles of the chart.
3. Organizational Process Mapping: If you’re working on an organizational project, you may want to consider using organizational process mapping techniques to develop your flowchart. This approach helps you map out the different processes and components involved in your project, and it provides recommendations on how to improve them. It also helps you understand the inefficiencies and bottlenecks in your current processes and identify areas where you can make changes for better efficiency.
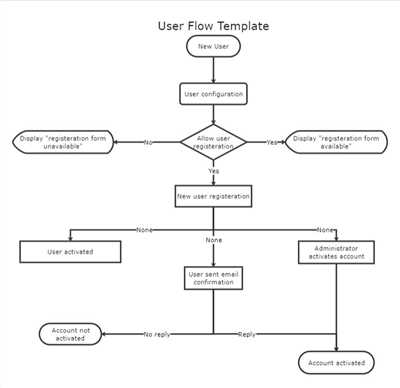
4. Online Flowchart Templates: Another option is to use online flowchart templates that are available on various websites. These templates provide you with predefined shapes and symbols, making it easier for you to create your flowchart. You can simply choose the template that suits your needs, customize it with your own information, and publish it.
5. Collaborative Flowchart Software: If you’re working on a project with multiple team members and need to share and collaborate on the flowchart, you may want to consider using collaborative flowchart software. This type of software allows multiple users to work on the same flowchart simultaneously, making it easier for everyone to contribute and make changes in real-time.
In conclusion, there are various sources you can use to prepare a flowchart. Whether you choose to draw it manually, use flowchart maker software, organizational process mapping, online templates, or collaborative software, the key is to select the right source that suits your needs and helps you create an effective flowchart.