
If you want to take control of your expenses and make smarter financial decisions, creating a budget chart can be a powerful tool. It allows you to visually analyze your spending patterns and identify areas where you can save more money. In this article, we will guide you through the step-by-step process of creating a budget chart using an Excel spreadsheet. Whether you’re a budgeting beginner or looking for more advanced techniques, you’ll find helpful insights here.
Step 1: Begin Your Budget Worksheet
The first step in creating a budget chart is to fill in your monthly income and expenses in an Excel template or any other spreadsheet program you prefer. Start by listing all your sources of income, such as your paycheck or any additional investments or side gigs you may have. Then, add a breakdown of your expenses into various categories, such as transportation, entertainment, health, and more.
Step 2: Input Your Monthly Expenses
Once you have listed all your sources of income and categorized your expenses, it’s time to input the actual amounts for each expense. This step can be a bit tedious, but it is crucial for an accurate budget chart. Be thorough in listing all your expenses, no matter how small, to ensure you have a comprehensive overview of your spending habits.
Step 3: Create a Visual Budget Chart
Now that you have all the necessary data in your budgeting spreadsheet, it’s time to create a visual representation of your budget chart. You can use Excel or any other spreadsheet program to draw the chart. Visualizing your budget will provide a simple and easy-to-understand overview of your income and expenses, allowing you to identify potential areas for improvement.
Step 4: Export Data for Further Analysis
In case you’re looking for more insights into your budgeting habits, you can export the data from your budget chart into other documents or software. This will allow you to analyze your spending patterns in more detail and identify any potential drawbacks or benefits of your current budget management strategy.
Step 5: Use Budget Templates and Network
If you’re just getting started with budgeting or need some inspiration, it can be helpful to use pre-made budget templates. Many budgeting software and websites offer free templates that you can easily fill in with your own data. Additionally, consider joining budgeting communities or forums where you can connect with others who are also on their budgeting journey.
By following these steps, you will be well on your way to creating a comprehensive budget chart that can help you better manage your finances. Remember, the key is to be consistent with your input and regularly update your budget chart to reflect any changes in your income or expenses. With time and practice, you’ll gain a deeper understanding of your spending habits and be able to make more informed financial decisions.
Budget Planning Chart
Creating a budget is an essential step in managing your personal finances. A budget planning chart can help you visualize how much money you have coming in and how much you’re spending, making it easier to track your expenses and identify areas where you may need to cut back or allocate more funds.
One popular tool for budget planning is a budget worksheet. A budget worksheet is a simple spreadsheet template that helps you list your income sources and expenses in various categories and provides a breakdown of your monthly budget.
To get started, you can use existing budget templates or create your own budget worksheet in Excel or other documents management software. The template should typically have columns for income, expenses, and a summary line at the bottom to display the difference between your income and expenses.
First, fill in the income section with all your sources of income, such as your salary, investments, or other sources. Next, you can fill in the expenses section with all of your monthly expenses. This can include categories like housing, transportation, entertainment, health, and more. You can easily add or modify categories to fit your specific needs.
Once the income and expense sections are filled out, you can click on a cell in the summary line to see a visual representation of your budget. The chart will provide insights into how much money you have left over each month, or if you’re overspending in any category.
The benefits of using a budget planning chart are numerous. It helps you easily track your expenses, identifies areas where you can save money, and provides a visual representation of your financial health. Additionally, budget templates often come with pre-made formulas and other features that can automatically calculate expenses or export your budget into other formats.
However, it’s important to note that budget planning charts do have some drawbacks. They rely on your input, so if you forget to fill in expenses or update income sources, the chart may not accurately reflect your financial situation. Also, they may not account for all potential expenses, so it’s crucial to regularly update the worksheet as new expenses arise.
In summary, a budget planning chart is a valuable tool for managing your personal finances. By creating a budget and tracking your income and expenses, you can gain better control over your finances and make informed financial decisions.
Budgeting Using a Simple Budget Template
When it comes to personal budgeting, using a simple budget template can be extremely helpful. With the use of a spreadsheet, you can easily track and manage your monthly expenses, providing you with a clear overview of where your money is going. Plus, budgeting templates allow you to identify potential areas for savings and make adjustments accordingly.
To begin budgeting using a simple template, the first step is to find a suitable budgeting worksheet. There are various sources online where you can find free templates, or you can create your own in Excel. Once you have your template, you can input your expenses into the corresponding columns. Usually, these templates will have categories like transportation, entertainment, groceries, and others, allowing you to break down your expenses and get a clear picture of where your money is going.
One of the primary benefits of using a budget template is that it provides a visual representation of your expenses. By clicking on the different sections of the chart or by hovering your mouse over a specific line, you can gain insights into your spending habits and see how much money you’re allocating to each category. This visual representation makes it easier for you to identify areas where you might be overspending and, if necessary, make adjustments to your budget to ensure you stay on track.
Another helpful feature of budget templates is the ability to export the documents. This comes in handy when you need to provide expense breakdowns for specific periods, whether it’s for your personal records or for other financial planning purposes. By exporting the template, you can easily access and share this information with others, saving you time and effort.
However, it’s important to note that using a budget template has its drawbacks. While it’s easy to fill in the columns with your expenses, the template might not account for every potential expense. You may need to add additional categories or modify the existing ones to fit your specific needs. Additionally, the template may not account for fluctuations in income or unexpected expenses, which is why it’s important to review and adjust your budget on a regular basis.
In conclusion, using a simple budget template can be an effective tool for budgeting and expense management. Whether you’re getting started with budgeting or you’re looking for a more efficient way to track your finances, a budget template will help you stay organized and in control of your money.
Step 1

Creating a budget chart can provide several benefits. It helps you easily track your expenses, plan your investments, and gain insights into your financial health. In this step, we will guide you on how to create a budget chart using a simple template.
There are various sources available online where you can find budget templates. You can start by clicking here to search for templates that suit your needs. Once you have chosen a template, the first step is to input your monthly income in the appropriate section. This could be your paycheck or any other source of income you have.
The next step is to fill in the various expense categories. It is helpful to break down your expenses into different sections. For example, you can have categories like transportation, entertainment, groceries, utilities, and more. Fill in these categories in the template.
Now, let’s move on to the next section of the template. Here, you will find columns for each month of the year. The first column is for your expense categories, and the following columns represent each month. Fill in the estimated expense amount for each category in each month. This will help you track your expenses on a monthly basis.
The template will automatically provide a summary of your expenses at the bottom line of each month and the health of your budget. You can easily see how much money you have left after deducting your expenses from your income.
One of the primary benefits of using a budget chart is that it helps you visualize the difference between your income and expenses. It also helps you identify areas where you can cut down on expenses or make investments. With a budget chart, you can easily see where your money is going and adjust your spending accordingly.
The drawbacks of budgeting using a chart template are that it may not be as flexible as a spreadsheet. Also, the template may not include all the expense categories that are relevant to you. However, it’s a great starting point for getting organized and tracking your expenses.
Once you have filled in all the information, you can export the chart or print it out for future reference. This chart will help you ensure that you stay on track with your budget and financial goals.
Step 2
Once you have your budget template set up, the next step is to add your personal expenses and income. This can be easily done by creating sections or columns in your budget chart to track different areas of your financial management.
Start by clicking on the “Add” or “+” button next to your primary expense categories, such as housing, transportation, entertainment, and health. This will create new sections or columns where you can input the specific expenses and income for each category.
For example, if you’re planning to fill out a monthly budget chart, you may have sections for rent/mortgage, utilities, groceries, transportation, entertainment, and health. In each section, fill in the various expenses and income you expect to have for the month.
Using the built-in worksheet functions in Excel or other spreadsheet software can be very helpful in automatically calculating the totals and summary for each section. This will provide you with a visual breakdown of how much you’re spending on each category and the difference between your income and expenses.
The input you made in Step 2 will be the basis for creating the budget chart. You can easily draw insights into your spending and potential areas for saving or investments. Additionally, it’s important to carefully review these expenses and make adjustments as needed to stay within your budget.
One of the benefits of using budget templates or worksheets is that they offer a simple and organized way to manage your finances. However, there are some drawbacks to consider. The template may not provide a comprehensive view of all your expenses, and it may not account for changes in your income or other personal circumstances. To overcome this, you can create additional sheets or documents to track those specific areas and make necessary adjustments.
Keep in mind that budgeting is an ongoing process, and you should regularly update your budget chart to reflect any changes in your income or expenses. By staying proactive and consistent with your budgeting efforts, you can gain better control over your finances and achieve your financial goals.
Step 3
Once you have your budget template set up and your income and expenses listed, it’s time to start creating your budget chart. This chart will help you visualize how your money is being spent and make it easier to track your expenses on a monthly basis.
To begin, open your budget spreadsheet and find the “Budget Chart” tab or sheet. This is where you will be creating your chart. If you don’t have a pre-made budget chart template, there are various free templates available online that you can use as a basis for your chart. Simply search for “budget chart templates” in your preferred search engine and choose a template that suits your needs.
Once you have found a template or created your own, go back to your budget spreadsheet and navigate to the “Budget Chart” tab or sheet. Here, you will start drawing your chart.
First, create two columns: one for the categories or sections of your expenses (e.g., “Housing”, “Transportation”, “Health”, “Entertainment”, etc.), and the second for the budgeted amount for each category.
Next, you will input the actual expense amounts for each category. For example, in the first column, under “Transportation”, you may list expenses such as “Gas”, “Car Insurance”, “Public Transportation”, etc. In the second column, you will assign a budgeted amount for each expense.
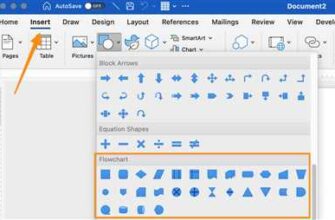
Once you have input all your expenses, you can now create the budget chart. In Excel or other similar spreadsheet documents, you can easily create a chart by selecting the data you want to include in the chart, then clicking on the “Insert Chart” button. This will automatically generate a chart based on the data you provided.
The chart will provide a visual representation of your budget, making it easier to see at a glance where your money is going. You can choose from various chart types, such as line charts, bar charts, or pie charts, depending on what best suits your needs.
One potential drawback of using a budget chart is that it only provides a summary or overview of your budget. You won’t get detailed insights into your spending habits or potential areas where you can save money. However, the chart can still be a helpful tool in your budgeting and money management planning.
Here are some steps to export your budget chart:
- Open your budget spreadsheet.
- Navigate to the “Budget Chart” tab or sheet.
- Select the chart you want to export by clicking on it.
- Go to the “File” menu and choose the “Export” option.
- Select the desired file format for your chart (e.g., PDF, image file, etc.).
- Choose the location where you want to save the exported chart.
- Click the “Save” button to export the chart.
By following these steps, you can easily export your budget chart and share it with others or save it for future reference.
With your budget chart in place, you can now use it to track your expenses and make adjustments as needed. Keep in mind that budgeting is an ongoing process, and you may need to make changes to your budget throughout the month. However, having a visual representation of your budget can help you stay on track and make more informed decisions about how you allocate your money.
Step 4
Now that you have your budget worksheet set up with categories and a breakdown of your expenses, it’s time to create a visual representation of your budget. This will make it easy to see where your money is going and how much you have left in each category.
One way to do this is by using Excel or other spreadsheet software. You can input your budget data into the cells and then create a chart by selecting the relevant data and clicking on the chart object. There are various templates available here that can help provide a simple and easy way to create a budget chart.
In the case of the budget worksheet we have been working on, you will want to use the expense breakdown you made in Step 3. This is where you listed all of your expenses and categorized them. In the columns next to your expense categories, you will input how much you plan to spend in each category for the month.
Once you have inputted all your expenses, you can create a chart that will automatically update as you add new expenses or change existing ones. This chart will show you a visual summary of your budget and give you insights into where you may need to make adjustments.
There are some benefits to using a budget chart. It can help you track your spending on a monthly basis, breaking down your expenses into various categories. This can be helpful for personal budgeting, as well as for planning for future expenses or investments.
On the other hand, there are some drawbacks to relying solely on a budget chart. It does not provide a detailed breakdown of your income or other potential sources of money. It also does not take into account any documents or spreadsheets you may have that need to be easily exported or added to the budget.
Overall, a budget chart can be a useful tool for getting a simple and visual overview of your budget. It can help you see where your money is going and where you may need to make adjustments. However, it should not be the only method of budget management you rely on. Using a combination of budget charts, budget worksheets, and other budgeting tools can provide you with a more comprehensive understanding of your financial situation.
Step 5
Now that you have set up your budget chart, it’s time to begin tracking your expenses. Fill in each category with the expenses you have for the month. The spreadsheet template will provide you with some helpful sections to begin with, such as “Transportation,” “Entertainment,” “Health,” and “Investments.” However, feel free to add or modify these categories based on your personal needs.
For each expense, input the amount in the corresponding column. The chart will automatically calculate the difference between your monthly budget and the actual amount you spent. This will help you see if you’re overspending or staying within your budget.
In case you are not using an Excel chart template, you can easily create your own budget chart by drawing a simple table with columns for each category and a row for each month. Here, you can list out all your expenses and track how much money you’ve spent in each category over time.
It’s important to track both your primary expenses and other potential expenses to get a more accurate breakdown of your budget. For example, if you have a paycheck coming in every month, you can include a line item for that as well. Similarly, if you have other sources of income, include them in the budget chart.
By tracking your expenses on a regular basis, this budget chart will help you with your budgeting and financial planning. It’s a simple and easy way to see where your money is going and identify any potential drawbacks or areas where you can save more.
Once you have your expenses inputted, you can export the budget chart to various documents or formats by clicking on the “Export” button. This can be helpful if you need to share your budget with others or want to have a visual representation of your budget over time.
Remember, the budget chart is just a tool to help you manage your finances. It’s important to regularly review and update your budget chart to ensure accuracy and stay on top of your financial goals.
Benefits
Using a budget chart has numerous benefits:
- Easy to Use: Budget charts provide a simple and visual way to track your expenses. With the help of pre-made templates or spreadsheet software such as Excel, you can easily fill in the necessary information and start budgeting.
- Financial Planning: Budget charts help you plan your finances effectively by providing a breakdown of your expenses. You can allocate your income on a monthly basis, ensuring that you have enough money for necessary expenses and also have some left for entertainment or other investments.
- Insights and Management: Budget charts allow you to gain insights into your spending habits. By categorizing your expenses into various sections such as transportation, health, entertainment, etc., you can easily identify areas where you can cut back and save money. It also helps in tracking your monthly expense patterns.
- Summary of Expenses: A budget chart acts as a summary of your expenses. It helps you see the bigger picture by providing a visual representation of where your money is going. This way, you can easily identify areas where you may be overspending and make necessary adjustments.
- Track Your Progress: With a budget chart, you can track your progress and see how much money you have saved over time. By inputting your income and expenses on a regular basis, you can easily see the difference between your income and expenses at the bottom line. This helps you stay focused on achieving your financial goals.
- Export and Share: Most budget chart templates or spreadsheet software allows you to export your budget data to other documents or share it with others. This feature enables you to collaborate with family members or financial advisors and get their input on your budget plan.
In conclusion, budget charts provide a simple and effective way to manage your finances. By using a budget chart, you can easily track your expenses, plan your financial goals, gain insights into your spending habits, and stay focused on achieving financial stability.
Drawbacks
While creating a budget chart in Excel can be a simple and easy way to track your expenses, there are some drawbacks that you should be aware of. Here are a few potential drawbacks:
1. Limited templates: Excel provides some basic budget templates to get you started, but these may not always meet your specific needs. If you have a more complex budget or want to include additional categories, you may need to create your own template from scratch.
2. Manual input: In order to fill in the budget chart, you’ll have to manually enter your expenses for each category on a monthly basis. This can be time-consuming and may require you to keep a detailed list of your expenses in order to accurately track them.
3. Lack of visual representation: The budget chart in Excel is primarily a spreadsheet, so it doesn’t provide a visual breakdown of your expenses. If you prefer a more visual representation of your budget, such as a pie chart or line graph, you’ll need to create these separately using Excel’s charting tools.
4. Limited export options: While you can easily export your budget chart to other Excel documents or sheets, there are fewer options for exporting to other file formats or online budgeting tools. This can make it difficult to share your budget with others or use it in conjunction with other financial management software or apps.
5. Lack of automation: Unlike some other budgeting tools, Excel does not automatically update your budget chart as you input new expenses. You’ll need to manually update and adjust the chart yourself, which may require more effort and attention to detail.
In summary, Excel can be a helpful tool for budget planning, but it does have its drawbacks. If you’re looking for a more automated and visual budgeting solution, you may want to explore other software or online tools that provide more templates, automation, and customization options.
Getting Started With a Personal Budget Template in Excel
Creating a personal budget can be an effective way to manage your finances. Using a budget template in Excel can make the process much easier, as it provides a structured format for tracking your expenses and income. In this article, we will guide you through the steps of getting started with a personal budget template in Excel.
Step 1: Open Excel and create a new workbook. You can do this by clicking on the Excel icon on your desktop or by searching for it in the Start menu.
Step 2: Once you have opened Excel, click on the “File” tab in the top left corner and select “New”. In the search bar, type “budget” to find various budget templates made available by Excel. Select a template that suits your needs and click on the “Create” button.
Step 3: The budget template will open with multiple sheets. The first sheet is usually the input worksheet, where you can fill in the details of your income and expenses. The other sheets may provide helpful documents, such as a monthly expense breakdown or a summary of your budget.
Step 4: Start by filling in your income details in the input worksheet. List down all the sources of income you have, such as your paycheck or any other investments. Enter the amounts in the corresponding columns.
Step 5: Next, fill in the expense details. List down all the categories you have, such as transportation, health, entertainment, and so on. Enter the amounts you spend on each category in the corresponding columns.
Step 6: If you have any other expenses that are not covered by the existing categories, you can easily add new rows to the worksheet by clicking on the bottom line and then clicking on the “Insert” button.
Step 7: Once you have entered all your income and expenses for the month, your budget chart will automatically update to show you how much you have left to spend or save. This allows for better money management and planning on a month by month basis.
Step 8: In case you want to track your expenses on a daily basis, you can use the other sheets provided in the budget template. These sheets will provide you with a breakdown of your expenses and an overview of your budget for each month.
Step 9: Excel also allows you to export your budget chart to a PDF or other formats, making it easy to share with others or keep it as a record for yourself.
Using a personal budget template in Excel has many benefits and potential drawbacks. The primary benefit is that it provides a simple and easy way to track your expenses and income. The potential drawbacks include the need to manually input and update your expenses, as well as the limitations of the pre-defined categories in the template.
In summary, getting started with a personal budget template in Excel is a straightforward process. By following the steps outlined above, you can easily create a budget chart that helps you keep track of your finances and achieve your financial goals.
The Bottom Line
Creating and managing a budget is an essential task for personal finance management. It helps you track your expenses, plan for future investments, and understand how much money you have available for various needs. One helpful tool for budgeting is a budget chart.
A budget chart is a visual representation of your monthly expenses and income. It provides a clear breakdown of where your money is going and helps you identify areas where you can cut back or invest more. There are various templates and documents available, such as Excel spreadsheets or budgeting software, that can easily be filled in to create a budget chart.
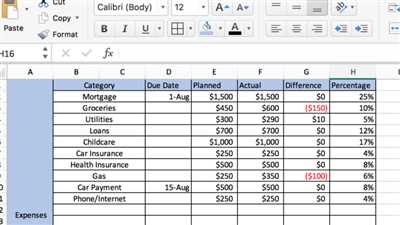
A budget chart typically consists of several sections. The first section is for your income, where you list your paycheck or other sources of money. The second section is for your expenses, where you fill in the various categories such as transportation, entertainment, health, and more. The third section is a summary of your expenses, which automatically calculates the total amount spent in each category. The fourth section is a breakdown of your expenses by percentage, which provides insights into how much of your budget is going towards each category.
One of the benefits of using a budget chart is that it makes budgeting easy and more manageable. By clicking a few buttons or filling in a few columns, you can quickly see where your money is going and identify potential areas for improvement. It also helps you stay on track with your financial goals by visualizing your spending habits. In case of any changes in your income or expenses, you can easily update the chart and see the difference it makes in your budget.
However, there are some drawbacks to consider when using a budget chart. First, it requires disciplined record-keeping and updating on a regular basis to ensure accuracy. Second, it may not provide a comprehensive view of your financial situation, as it focuses primarily on expenses and may not take into account other financial aspects such as investments or savings. Finally, while budgeting is helpful, it may not be the sole solution for financial management. It is important to also consider other aspects of personal finance, such as debt management, insurance, and retirement planning.
In conclusion, a budget chart is a helpful tool for personal budgeting and money management. It provides a visual representation of your income and expenses, helping you track your spending and identify areas for improvement. While it has some limitations, such as the need for regular updating and potential overlooking of other financial aspects, it can still provide valuable insights and aid in achieving your financial goals.
Sources
When it comes to creating a budget chart, there are various sources you can turn to for insights and assistance. Here are some helpful options to get you started:
- Personal Money Management Apps: There are numerous budgeting apps available that provide easy-to-use templates and charts to track your expenses. Many of these apps allow you to input your expenses and automatically provide a visual breakdown of where your money is going.
- Spreadsheet Templates: Using a spreadsheet program like Excel, you can find pre-made budget templates that can be customized to fit your needs. These templates often have columns for various expense categories, making it easy to fill in the necessary information.
- Financial Planning Worksheets: Some banks and financial institutions provide worksheets or documents that can help with budget planning. These worksheets typically have sections for income, expenses, and potential investments.
- Online Budgeting Tools: There are online tools available that allow you to enter your income and expenses and then provide a summary of your budget. These tools often have additional features, such as the ability to export your budget chart or network with other users.
No matter which source you choose to use, having a budget chart can be beneficial for money management. It allows you to have a clear picture of your income and expenses, helping you make informed financial decisions and track your progress toward your financial goals.