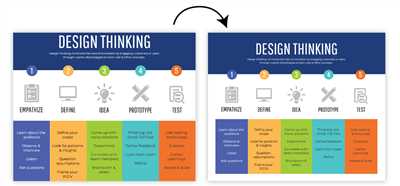
Infographics have become a popular and effective way to present information in a visually compelling format. With so much content available for readers to consume, it’s important to grab their attention quickly and keep them engaged. Infographics can do just that by presenting information in a concise and visually appealing manner, making it easier for readers to digest and understand.
In this article, we will guide you through the process of creating an infographic step-by-step. We’ll show you how to choose the right tools, write compelling content, and design the infographic in a way that will wow your audience.
The first step in creating an infographic is to determine your target audience and what information you want to convey. By identifying your target audience, you can tailor the content to their preferences and needs. Once you have a clear understanding of your audience, you can start gathering the facts and data that are relevant to your topic.
Next, you’ll want to create a logical flow for your infographic. This includes organizing the information in a way that makes sense and leads the reader through the content. You can use shapes and arrows to guide the reader’s eye and ensure they are following along with your argument. Balance the text and visuals in a way that maintains the reader’s interest and prevents information overload.
Now, it’s time to design your infographic. You can choose from a variety of templates and tools to make the design process easier. Tools like CorelDRAW can help you create visually appealing and professional-looking infographics. When designing, pay close attention to the size and placement of elements. Use colors, shapes, and fonts that complement your content and grab the reader’s attention. Maintaining a balance between text and visuals is key to producing an effective infographic.
Once you have finished designing, make sure to proofread your text and ensure that all the facts and information are accurate. You don’t want to present your audience with incorrect or misleading information. When you’re ready to share your infographic, consider including a headline or a brief introduction to explain the purpose and main points of your infographic. This will make it easier for readers to understand and relate to your content.
In conclusion, creating an infographic can be a fun and creative way to present information to your readers. By following the basic principles of design and using the right tools, you can produce an infographic that not only presents information but also grabs the attention of your audience. So go ahead and start creating your own impressive infographics!
- How to Make an Infographic: A Step-by-Step Guide
- Table of Contents
- Create the Basic Shapes
- The Principles of Infographic Design
- 1 Write a great headline
- 2 Create a logical flow
- 3 Focus your content
- 4 Target your audience
- 5 Pay attention to length and size
- 6 Balance text and graphics
- Step 4: Design
- Wow the Crowd
- Sources
- Videos:
- How to Make an Infographic in 5 Steps [INFOGRAPHIC DESIGN GUIDE + EXAMPLES]
How to Make an Infographic: A Step-by-Step Guide
Infographics are a great way to grab the attention of your audience and present information in a visually appealing and easy-to-understand manner. In this step-by-step guide, we will show you how to create an infographic that will wow your readers.
- Create a plan: Before you start creating your infographic, you need to have a clear idea of what you want it to achieve. Identify your target audience, and determine what information you want to convey.
- Gather your content: Research and gather information and data from reliable sources that support your message. Ensure that you have enough facts and statistics to make a compelling argument.
- Design the layout: Decide on the size and shape of your infographic. You can choose from pre-made templates or create your own layout. Keep in mind that the design should flow logically and guide the readers’ attention from one section to another.
- Organize your information: Divide your content into sections and create a logical flow. Use headings, subheadings, and bullet points to break up the text and make it easier to read and understand. Use graphics and shapes to visually represent your information.
- Select the right tools: There are many tools available for creating infographics, such as Adobe Illustrator, Canva, and CorelDRAW. Choose the tool that you are most comfortable with and that has the features you need.
- Create the infographic: Open your chosen design tool and start working on your infographic. Use the tools provided to create shapes, add graphics, and input text. Pay attention to the colors and fonts used to maintain a cohesive design.
- Give it a headline: Your infographic should have a catchy and informative headline that grabs the attention of your audience. Keep it short and to the point.
- Add visuals: Graphics and visuals are an essential part of an infographic. Use relevant images, icons, and illustrations to enhance your content and make it more visually appealing.
- Format and style: Make sure that your infographic is well-formatted and visually consistent. Use a consistent color scheme, fonts, and sizes throughout the infographic. Pay attention to the alignment and spacing of the elements.
- Proofread and edit: Before finalizing your infographic, ensure that all the information is accurate and well-written. Check for any grammar or spelling errors, and make sure that the content is clear and concise.
- Share your infographic: Once your infographic is complete, save it in a suitable format (such as JPEG or PNG) for easy sharing. You can publish it on your blog, social media platforms, or use it for marketing purposes.
By following these steps, you can create a visually appealing and informative infographic that effectively communicates your message to your target audience. Remember to focus on the core principles of design and maintain a logical flow of information to avoid overwhelming your readers. With enough creativity and effort, your infographic can stand out from the crowd and make a lasting impact.
Table of Contents
1. Introduction
2. What is an Infographic?
3. Why Infographics are Important in Marketing
4. How to Choose the Right Infographic Template
5. Step-by-Step Guide to Creating an Infographic
6. Design Principles for Creating Effective Infographics
7. Tools to Use for Creating Infographics
8. How to Maintain Balance and Attention in Infographics
9. Tips for Writing Short and Relevant Text in Infographics
10. How to Make Your Infographic Stand Out
11. Conclusion
Create the Basic Shapes
When it comes to creating infographics, one of the first steps is to create the basic shapes. These shapes will serve as the foundation for your infographic and will help you organize and present your information in a logical and visually appealing way.
There are several tools you can use to create the basic shapes for your infographic. Adobe Illustrator, CorelDRAW, and Canva are popular options among designers. Select a tool that you are comfortable with and one that has the features you need.
Start by choosing a shape that will best fit the content you want to present. If you are creating an infographic about marketing, for example, you may want to use rectangles to represent the different marketing channels you will discuss. Similarly, if you are creating an infographic about a step-by-step guide, you can use arrows to show the flow of the process.
Once you have selected a shape, you can then drag and resize it to the desired length and size. Make sure to maintain a balance between the size of the shape and the amount of content you want to include. If the shape is too small, it may not be enough to hold all the facts you want to show. On the other hand, if the shape is too large, it may grab too much attention and overwhelm the other contents of your infographic.
When creating the basic shapes, also pay attention to the inward and open space of the shapes. If the shape is too closed, it may give a claustrophobic feel to your infographic. Conversely, if the shape is too open, it may lose focus and look disorganized.
Remember to keep the design of your infographic relevant to your target audience and the core message you want to convey. Your infographic should be visually appealing and easy to read, so make sure to choose colors, fonts, and graphics that work well together.
Finally, don’t forget to write a short but informative headline for your infographic. The headline should grab the attention of your audience and give them a quick preview of what your infographic is about. A well-crafted headline can make a great first impression and entice readers to explore your infographic further.
By following these step-by-step principles, you can create the basic shapes for your infographic and start working on the contents of your infographic. Remember to maintain a balance between the text and graphics, and avoid information overload. Infographics are meant to present information in a visually appealing way, so focus on the key facts and make sure they are easy to understand.
The Principles of Infographic Design
Infographics are a powerful tool in content marketing. They not only grab the attention of readers, but also present information in a visually appealing and easily digestible format. To create great infographics, you need to follow some core principles of design. Here is a step-by-step guide on how to prepare infographics that wow your audience and make them want to read more.
- Focus on the content: Before you start designing, make sure you have a clear understanding of the topic you want to present in your infographic. Research relevant facts and gather enough data to support your argument. The content of your infographic should be concise and to the point.
- Choose the right design: The design of your infographic should be visually appealing and align with your target audience. There are many templates available online that you can use as a starting point. Alternatively, you can work with a designer who can help you create a custom design that suits your needs. Make sure to choose a design that is logical and easy to follow.
- Keep it simple: Infographics should be easy to read and understand. Avoid information overload by keeping the text short and using graphics to support your content. Use shapes and visual elements to guide the reader’s eye through the infographic. Maintain a balance between text and visuals to make your infographic visually appealing.
- Use proper formatting: Organize your information in a clear and logical way. Use headings and subheadings to break up the content into sections. Use bullet points or numbered lists to present information in a step-by-step manner. This helps readers to quickly grasp the main points of your infographic.
- Make it visually appealing: Use colors, fonts, and graphics that are visually appealing and consistent with your brand. Use visuals to illustrate your key points and make your infographic more engaging. Choose a layout that presents your information in a visually appealing way, such as using an inward rectangle shape to guide the reader’s attention to the core message.
- Pay attention to size and length: Ensure that your infographic is visually appealing and well-proportioned. Use a size that is appropriate for the platform you are publishing your infographic on. Keep in mind that infographics that are too long may lose the reader’s attention, so try to keep it concise and focused.
By following these principles of infographic design, you can create visually appealing and engaging infographics that effectively communicate your message to your target audience.
1 Write a great headline
When creating an infographic, one of the first steps you’ll want to take is to write a great headline. The headline is the short, attention-grabbing phrase that will grab the reader’s attention and make them want to read further.
Here are 3 core principles to follow when crafting a great headline:
1. Be short and to the point: Your headline should be concise and impactful. It should clearly state the main argument or facts you want to present in the infographic. Keep in mind that readers have a short attention span, so you want to make your headline as quick and catchy as possible.
2. Select relevant contents: Choose the most relevant information that you will present in your infographic. You want to logically select the facts or steps that will be most interesting and valuable to your audience.
3. Maintain a logical flow: Your headline should give a brief overview of the information you will be presenting in the infographic. It should guide the readers and create a logical flow from the headline to the rest of the content.
By following these principles, you can create a headline that will grab the attention of your target audience and make them want to learn more about your topic.
In addition to the headline, it’s also important to create a visually appealing infographic. Use graphics and shapes to present information in a visually appealing way. Shapes like rectangles or arrows can be used to create a step-by-step flow or to highlight important points.
Tools like CorelDRAW can be used to design your infographic and create templates that you can use for future projects. Make sure to balance the amount of text and graphics in your infographic, so it’s not overloaded with information. Keep in mind that the size and length of your infographic should be enough to present the information, but not too long to overwhelm the readers.
By following these step-by-step guidelines, you can create a great infographic that will wow your audience and effectively communicate your message.
| Key Points: |
|---|
| 1. Write a short and attention-grabbing headline. |
| 2. Select relevant facts or steps to present in your infographic. |
| 3. Maintain a logical flow from the headline to the content. |
| 4. Use graphics and shapes to create a visually appealing design. |
| 5. Balance the amount of text and graphics in your infographic. |
| 6. Use tools like CorelDRAW to design your infographic and create templates. |
2 Create a logical flow

When creating an infographic, it’s important to have a logical flow that guides your audience through the information you want to present. This helps maintain their interest and ensures they stay engaged with your content.
Start by choosing a topic and then focus on gathering relevant facts and information. This will be the core of your infographic, so make sure to choose information that is interesting to your target audience.
Once you have your content, you can start to think about how you want to visually present it. You can use basic shapes like rectangles and arrows to create a step-by-step flow that guides the reader through your infographic.
Balance the use of text and graphics in your design. Too much text can overload the reader with information, and too few graphics may not grab their attention. Use images, charts, and icons to help illustrate your points and make the information visually appealing.
If you’re not a designer, there are tools and templates available that can help you create visually stunning infographics. Applications like Adobe Illustrator, Canva, and CorelDRAW offer easy-to-use design tools and pre-designed templates that you can customize to fit your needs.
When designing your infographic, consider the size and placement of each element. You want the information to be easily readable, so pay attention to font size and color contrast. Also, make sure to choose colors that are visually appealing and relevant to your topic.
To create a logical flow, you can use a table to organize your content into sections and sub-sections. This helps keep your information organized and easy to follow.
Remember to write a short and catchy introduction that grabs your readers’ attention. This will give them a quick overview of what the infographic is about and why they should keep reading.
As you work on your infographic, keep in mind the step-by-step guide you want to create. Make sure each section logically leads into the next, so your readers can follow the argument or information you’re presenting.
Where possible, use visuals to show facts and statistics instead of just writing them out. This will make your infographic more visually appealing and easier to understand.
Inward links: how to make infographics, how to prepare infographics, how to design infographics
3 Focus your content
When it comes to creating infographics, it’s important to focus your content in order to effectively convey your message. Infographics are a visual representation of data or information, so you want to make sure that the content you include is both visually appealing and informative.
The first step in focusing your content is to choose a relevant and engaging headline. This will draw the attention of your target audience and make them want to read more. It’s important to choose a headline that is short, catchy, and tells the reader what the infographic is about.
Next, you’ll want to select the key facts and information that you want to present in your infographic. This is where you’ll need to do some research and gather data from reliable sources. It’s important to select information that is interesting and relevant to your audience. Remember to cite your sources and provide a balance of facts and supporting details to make your argument strong.
Once you have your content, it’s time to work on the design of your infographic. You can use design tools or work with a graphic designer to create visually appealing graphics and shapes that will grab the attention of your audience. Choose colors, fonts, and styles that work well together and align with your brand or the theme of your infographic.
When placing your content into the infographic, it’s important to maintain a logical flow. Start with an introduction that presents the topic and grabs the reader’s attention. Then, organize your content in a step-by-step or flowchart format, where information flows from one point to the next in a logical manner. Use tables, graphs, and other visual elements to break up the text and make it easier for readers to digest the information.
Remember to keep your infographic short and to the point. Infographics are meant to present information in a quick and digestible format, so make sure you’re not overwhelming your audience with too much information. If you have a lot of content, consider breaking it up into multiple infographics or creating a series of related articles on your blog.
To wow your readers and make your infographic stand out, you can also incorporate interactive elements or animations into your design. This will not only make your infographic more engaging, but also help to guide the viewer’s attention to the most important parts of the content.
In summary, when creating infographics, you want to focus your content by choosing a relevant and catchy headline, selecting key facts and information, and organizing your content in a logical and visually appealing way. Remember to keep your infographic short and maintain a balance between text and graphics. With these principles in mind, you’ll be able to create infographics that are both informative and visually appealing, capturing the attention of your target audience.
4 Target your audience
When creating infographics, it is important to keep your audience in mind. You want to make sure that the content you are presenting is relevant and interesting to them.
Start by selecting the size of your infographic. Consider the platforms where you will be sharing it and make sure the dimensions are suitable.
Then, think about the design elements that will grab your audience’s attention. Use graphics, shapes, and colors that will make your infographic visually appealing.
Another important step is to maintain a logical flow of information. Make sure the facts and data are presented in a step-by-step manner that is easy to follow.
A key principle to remember is to balance the amount of text and graphics. You want to provide enough information to convey your message, but not overwhelm readers with an information overload.
Also, keep in mind that the headline of your infographic should be short, catchy, and to the point. It should give the audience a quick idea of what the infographic is about.
Work with a designer or use design tools like CorelDRAW to create a visually appealing infographic. Dragging and dropping shapes and templates can help you create a great design.
Remember to focus on the core message you want to convey and make sure it is clear and easy to understand. Use facts and arguments that support your message and present them in a logical and organized way.
When writing the contents of your infographic, make sure they are well-researched and reliable. Cite your sources if needed, and make sure the information is accurate and up-to-date.
Finally, don’t forget to test your infographic on a sample audience. Get feedback and make any necessary adjustments before sharing it with a wider crowd.
By following these principles and steps, you can create an infographic that will wow your audience and effectively convey your message.
5 Pay attention to length and size
When creating an infographic, it’s important to pay attention to the length and size of your content. Infographics should be visually appealing and easy to understand, so keeping them concise and focused is key.
1. Choose the right length: Infographics are meant to provide a quick visual overview of a topic or argument. They should be short enough to maintain the audience’s attention, but long enough to provide enough relevant information. Aim for about 1-3 times the length of a typical blog article.
2. Select the appropriate size: The size of your infographic will depend on where you want to use it. If it’s for online marketing, consider the dimensions of social media platforms or blog templates. If it’s for print, make sure it fits well on standard paper sizes. Maintaining a balanced size will ensure that your infographic looks good and is easy to consume.
3. Focus on the core content: Infographics should have a clear and logical flow. Start with a headline that grabs attention, then present your facts or arguments in a step-by-step or table format. Use shapes and visuals to show the information instead of just writing it out. This will make your infographic more engaging and easier to understand.
4. Avoid information overload: While it’s important to include enough information, be careful not to overwhelm your audience with too much text or data. Keep your infographic visually appealing by using images, icons, and colors to convey your message. Use whitespace effectively to create balance and give the content room to breathe.
5. Use design tools effectively: To create your infographic, you can use design tools like CorelDRAW, Adobe Illustrator, or online templates. These tools provide pre-made shapes and elements that you can drag and drop onto your canvas. They also allow you to customize the size, colors, and spacing to fit your needs.
By following these principles and paying attention to the length and size of your infographic, you can create a visually appealing and informative piece of content that will wow your target audience.
6 Balance text and graphics
Creating an infographic is not just about throwing in a bunch of flashy graphics and slapping on some text. To make your infographic effective, you need to maintain a balance between the text and graphics. Here are some helpful tips to achieve that balance:
-
Start with a headline that grabs your audience’s attention. This headline should clearly communicate the main message or argument of your infographic.
-
Choose the right size and shape for your infographic. Depending on the content and target audience, you may want to use a rectangle or other shapes that work well with the flow of information.
-
Keep the text concise and to the point. In a visual medium like infographics, too much text can overwhelm the audience and distract them from the main message. Select only the most relevant facts and information to include.
-
Use visuals to support and enhance the written content. Graphics should help to illustrate or explain the information presented in the text. They should not overpower or overshadow the text.
-
Maintain a logical flow in the design and organization of your infographic. The information and visuals should be arranged in a way that guides the reader’s eye and presents the content in a logical sequence.
-
Use templates or tools to create a quick and great-looking infographic. There are many online tools available that offer pre-designed templates that you can customize according to your needs. These tools can save you time and effort in creating your infographic.
By following these basic principles, you can create an infographic that strikes the right balance between text and graphics. Remember to keep your audience in mind and make sure the visuals enhance the content rather than overshadow it. Happy infographic designing!
Step 4: Design
Design is a crucial step in creating an infographic that will grab and maintain the attention of your audience. The visual aspect plays a great role in how well your infographic is received and understood. In this step, you need to focus on the balance between the design and the information you want to present.
First, select a designer or use design tools like CorelDRAW to create your infographic. Keep in mind the size and shape of your infographic and make sure it is visually appealing enough to attract readers. You can use templates or create your own design from scratch, depending on your preferences and the style you’re aiming for.
Your infographic should have a logical flow, guiding the readers from one point to another. Arrange the information in a way that is easy to read and understand. Use headlines, subheadings, and short paragraphs to break up the content and make it more digestible. Also, consider adding relevant graphics, such as icons, charts, or tables, to support the information you’re presenting.
When designing your infographic, avoid information overload. Make sure that the text and visuals work together to deliver a clear and concise message. Use colors, fonts, and shapes strategically to create a visually appealing and cohesive design. Pay attention to the alignment and spacing of the elements to create a clean and organized look.
Remember that the design of your infographic should align with your target audience and the purpose of your infographic. If your infographic is for marketing purposes, you may want to use vibrant colors and eye-catching graphics to wow your audience. If it’s a more serious topic, you may choose a more muted and professional design.
Don’t forget to check the length of your infographic. You want to provide enough information to be informative, but not too much to overwhelm your readers. Keep the core facts and main points, and eliminate any unnecessary or redundant information.
In this step-by-step guide on how to prepare infographics, we have covered the basic principles of infographic design. By following these principles, you can create infographics that are visually appealing, easy to read, and grab the attention of your audience. So, open up your design tools and start creating stunning infographics!
Wow the Crowd
Creating a great infographic involves much more than just dragging and dropping some shapes and text onto a template. To wow the crowd and grab the attention of your audience, you need to pay attention to the design principles, content flow, and the overall visual appeal of your infographics.
Here are 6 steps to guide you in creating an infographic that will wow the crowd:
- Step 1: Choose the right topic and target audience – It’s important to select a topic that is relevant to your target audience and that presents information in a way that is interesting and engaging.
- Step 2: Gather and organize your content – Collect enough facts and data to support your argument and then arrange them in a logical and coherent manner. Make sure to focus on the core information that you want to communicate.
- Step 3: Design with balance and flow in mind – Use shapes, colors, and graphics to create a visually appealing design that maintains a balance between text and visuals. Pay attention to the size, shape, and placement of elements to guide the readers’ eyes and maintain their attention.
- Step 4: Grab attention with a catchy headline – The headline of your infographic should be short, catchy, and grab the attention of your audience. Use strong and concise language to communicate the main message of your infographic.
- Step 5: Create a logical and visually appealing flow – Arrange your content in a way that makes it easy for readers to follow and understand. Use a step-by-step or table format to guide the readers through the information.
- Step 6: Wow the crowd with your design skills – Use a graphic design software like CorelDRAW or open-source tools to produce visually stunning infographics. Make use of templates, shapes, and other design elements to create a unique and eye-catching design.
By following these principles and steps, you can create infographics that not only wow the crowd but also effectively communicate your message to your target audience.
Sources
Creating an infographic can be a quick and effective way to grab the attention of your target audience. If you’re not a graphic designer, don’t worry! There are plenty of tools and resources available to help you create great infographics.
1. Basic Design Principles: Before you start creating an infographic, it’s important to understand the basic principles of design. This will help you maintain a balance between text and graphics, choose the right shapes and colors, and create a visually appealing layout.
2. Select a Topic: The first step in creating an infographic is to choose a topic that is relevant and interesting to your readers. Make sure the topic is something you know enough about and can present in a clear and logical manner.
3. Gather the Facts: Once you have selected a topic, gather all the relevant facts and information you want to include in your infographic. Make sure the information is accurate and up-to-date.
4. Plan the Layout: Before you start designing, create a rough sketch of the infographic layout. Decide on the length and size of the infographic, and think about how to logically organize the information. You can create a table or a flowchart to show the step-by-step process or use shapes like rectangles and arrows to guide the readers.
5. Tools and Templates: There are many tools available to help you create infographics easily. Canva, Piktochart, and Adobe Spark are some popular options. These tools provide pre-designed templates and graphics that you can use to start creating your infographic.
6. Write a Powerful Headline: The headline of your infographic should be short and catchy. It should grab the attention of your audience and make them want to read more.
7. Visualize the Information: Once you have written the headline and gathered all the information, start designing the infographic. Use visuals such as icons, graphs, charts, and images to make the information more visually appealing and easy to understand.
8. Focus on the Core Message: When designing an infographic, keep in mind the core message you want to convey to your audience. Make sure all the visuals and text support this message and work together to tell a cohesive story.
9. Open up to a Crowd: Once your infographic is complete, don’t keep it to yourself. Share it with your audience on social media, your blog, or any other platforms where they can easily access and share it.
Remember, the key to creating a great infographic is to keep it visually appealing, simple, and relevant to your target audience. Pay attention to the length of the infographic, as you don’t want to overload your readers with too much information. Use the sources mentioned above to help you create infographics that wow your audience!

