
If you’re looking to create an eye-catching and memorable way to present information, infographics are a great tool to consider. With the help of an infographic maker like Piktochart, you’ll be able to convert dry, text-heavy data into visually engaging visuals that will grab attention and make your information easy to digest.
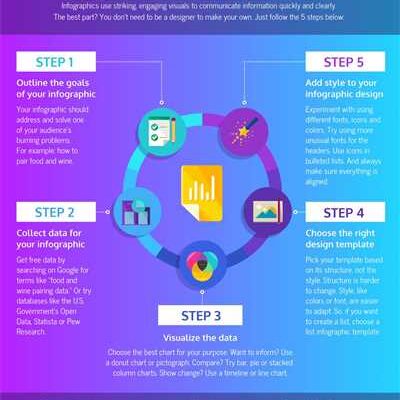
Creating an infographic is a process that involves several steps, but don’t worry! It’s not as difficult as it may seem. In this article, we’ll provide a summary of the four main steps you’ll need to follow to create your own infographic. Whether you’re an individual, a brand, an agency, or a team of professionals, this guide will help you get started on creating a great infographic.
Step 1: Research and Gather Information
The first step in creating an infographic is to gather all the necessary information and research. Start by identifying your target audience and determine the data that you want to visualize. Look for reliable sources of information such as research papers, official reports, or reputable websites. Make sure to cite your sources.
Once you have gathered all the information, organize it in a way that makes sense and supports the overall message of your infographic. Create a flow of information and think about how you want your audience to move through your infographic. This will make it easier to design and layout your visuals.
Step 2: Design and Layout
Now that you have your information ready, it’s time to open a design tool like Piktochart and start designing your infographic. Begin by selecting a template or starting from scratch. Use a line or a grid to divide your infographic into sections.
Choose fonts, colors, and graphics that align with your brand or message. Use icons, illustrations, and charts to visually represent your data. Be mindful of the visual hierarchy and ensure that your design is visually appealing and easy to understand. Remember, simplicity is key.
Step 3: Add Text and Visuals
With your design and layout in place, start adding text and visuals to your infographic. Use catchy headlines and subheadings to grab attention and guide your audience through the information. Write concise and informative text that complements your visuals.
Integrate your data into charts, graphs, or diagrams to make it easier to understand. Add icons or illustrations to make your infographic more visually appealing. Remember, visuals should not just be decorative; they should convey information in a clear and engaging way.
Step 4: Review and Publish
Once you have completed your infographic, take the time to review it for any errors or inconsistencies. Check that all the information is accurate and that the visuals support your message. Share your infographic with others and gather feedback to make any necessary improvements.
When you are happy with your finished infographic, it’s time to publish it. You can share it on your website, blog, social media platforms, or even use it as a printed handout. Infographics are a powerful way to present information, so don’t hesitate to showcase your hard work!
Now that you know the steps to create a great infographic, start gathering your information and get creative with Piktochart. With the right research, design, and visuals, you can create an infographic that will effectively communicate your message and engage your audience!
Four Steps For Creating Infographics That Convert
Infographics are a powerful tool for conveying information in a visually appealing way. They can help your website convert more visitors into customers by presenting complex information in a clear and concise manner. If you’re looking to create infographics that convert, follow these four steps:
Step 1: Research and Gather Information
Before you begin creating your infographic, it’s important to do thorough research and gather all the necessary information. This will ensure that your infographic is accurate and informative. Look for reliable sources and statistics that support your message. Take the time to understand your target audience and what information will be most valuable to them.
Step 2: Design and Visuals
Once you have your information gathered, it’s time to start designing your infographic. Use a tool like Piktochart or any other infographic maker to create visually appealing and engaging graphics. Remember to keep your design consistent with your brand’s style and color scheme. Use icons, charts, and graphs to help visualize the data and make it easier to understand.
Step 3: Organize and Structure
To ensure that your infographic flows smoothly and is easy to follow, it’s important to organize and structure your information in a logical way. Break down your content into sections and use headings to guide the reader through the information. Use bullet points or numbered lists to present key points concisely. This will make it easier for your audience to digest the information and stay engaged with your infographic.
Step 4: Share and Promote
Once your infographic is complete, it’s time to share and promote it. Use social media platforms like Facebook, Twitter, and LinkedIn to reach a wider audience. You can also submit your infographic to relevant websites or blogs in your industry. Consider collaborating with influencers or partnering with an agency to help promote your infographic. The more exposure your infographic gets, the more likely it is to convert visitors into customers.
In summary, creating infographics that convert involves four key steps: research and gather information, design and visuals, organize and structure, and share and promote. By following these steps, you’ll be able to create compelling infographics that effectively communicate your message and drive conversions for your website.
Why use an infographic
An infographic is a visual representation of information that can help convert complex data and research into an easy-to-read and visually appealing format. Infographics are great for summarizing information and presenting it in a way that is engaging for your audience.
There are several reasons why you should consider using an infographic for your brand or website:
1. Visual Appeal: Infographics use visuals like icons, graphs, and charts to present information in a visually appealing way. This can help grab the attention of your audience and make your content more memorable.
2. Easy to Understand: Infographics break down complex information into simple and understandable sections. They’re great for those who like to skim through information or for those who prefer to get a quick overview before diving into the details.
3. Shareability: Infographics are highly shareable on social media platforms like Facebook, Twitter, and Instagram. People love sharing visually appealing content, so you’ll likely see an increase in engagement if you use infographics as part of your social media strategy.
4. Branding: Infographics can help reinforce your brand identity by using your brand colors, logo, and overall design style. This can create a consistent brand image across all your marketing materials.
5. Conversion Rate: Infographics can help convert website visitors into customers by presenting information in a visually engaging way. Research has shown that visuals are more likely to be remembered and retained compared to plain text.
6. Opens up new sources of traffic: Infographics can also be a great way to attract new viewers to your website. When you create an infographic, you can share it on infographic directories and other websites that accept infographic submissions. This can help you reach a new audience and drive more traffic to your site.
7. Professionalism: Infographics are commonly used by professionals and agencies to present research findings or complex data. By using infographics, you can showcase your expertise and professionalism in your field.
Overall, infographics are a powerful tool in the design and information-sharing process. If you’re looking to create engaging and visually appealing content that is easy to understand, infographics are a great option to consider.
Why create an infographic
Infographics are a great way to convert complex information into visually appealing and easy-to-understand visuals. They’re open, you can use them on your website, share them on social media platforms like Twitter, and they’re highly shareable. Infographics are like a summary of your research or information, creating a visual line that helps your audience understand the main points quickly.
Creating an infographic can help you communicate your message more effectively and engage your audience. Whether you’re a brand, an agency, or a researcher, infographics can be a powerful tool in your content marketing strategy.
But why should you create an infographic? Well, there are several reasons:
- Infographics are more engaging than plain text. They use visuals to grab your audience’s attention and make your information more memorable.
- Infographics are highly shareable. People are more likely to share visual content, so creating an infographic can help your message reach a wider audience.
- Infographics are versatile. You can use them on your website, in presentations, or in social media posts.
- Infographics can help establish your brand as an authority in your industry. By creating well-designed and informative infographics, you show that you have expertise in your field.
- Infographics can simplify complex information. They break down information into digestible chunks, making it easier for your audience to understand.
- Infographics can help you stand out from the competition. In a sea of text-based content, infographics can make your brand more memorable and unique.
- Infographics can increase your website traffic. When people find your infographics interesting and informative, they’re more likely to visit your website to learn more.
If you’re not a design professional, creating an infographic may seem daunting. However, there are many tools available that can help you create professional-looking infographics even if you have no design experience. One popular tool is Piktochart, which offers templates and design elements to create stunning infographics.
So why not give infographics a try? With the help of infographics, you’ll be able to effectively share your information and engage your audience in a way that text alone cannot achieve.
How to Create an Infographic

Infographics are a great way to convert complex information into visuals that are easy to understand and share. Whether you’re a researcher looking to present your findings or a brand trying to catch your audience’s attention on social media, infographics can be a powerful tool in your marketing arsenal. In this article, we’ll go through the steps on how to create an infographic that will make an impact.
1. Do your research: Before diving into the design process, spend some time gathering all the information you want to include in your infographic. Make sure to use reliable sources and organize your data in a clear and structured manner.
2. Use an infographic maker: If you’re not a design professional, don’t worry! There are plenty of online tools like Piktochart that can help you create stunning infographics without any technical skills. Simply open their website and start exploring the available templates.
3. Create a summary: A good infographic should be concise and focused. Pick the most important points from your research and summarize them in a clear and engaging way. Avoid overcrowding your infographic with too much information – less is often more.
4. Design with your brand in mind: Infographics are a great opportunity to showcase your brand’s visual identity. Use colors, fonts, and graphics that align with your brand’s style. This will help you establish a consistent and recognizable visual presence across all your marketing materials.
Remember, when creating an infographic, it’s important to keep your audience in mind. Use visuals and language that resonate with them and make your information easily digestible. Whether you’re creating an infographic for social media or to include in a presentation, following these steps will help you create a visually appealing and effective infographic that gets your message across.
Sources

When creating infographics, it’s important to gather information from reliable sources. Here are four sources that can help you in the process:
- Websites: Many websites, like Piktochart, offer infographic makers that can assist you in creating visual representations of your information.
- Research papers: If you’re looking for accurate and detailed information, researchers often provide summaries or studies that can be converted into an infographic.
- Social media: Twitter and other social media platforms can be great sources of quick and up-to-date information. Follow professionals or agencies that specialize in your area of interest.
- Open data: Many organizations and governments open their data to the public. You can use this data to create informative and impactful infographics.
By using these sources, you’ll be able to gather the necessary information and convert it into a visually appealing infographic. Remember to always cite your sources and ensure the accuracy of the information you use!