If you want to create a flowchart diagram, you need to follow a specific set of steps. Flowcharts are widely used in business and project management to visualize processes and show the flow of information. To create a flowchart, you can use various software tools, such as Microsoft Visio, Lucidchart, or even Excel. In this article, we will look at how you can use Microsoft Visio to draw a flowchart diagram.
Once you have opened Microsoft Visio and started a new blank page, you can start creating the flowchart. The first step is to select the shapes you want to use for your flowchart. Microsoft Visio provides a group of built-in shapes specifically designed for flowcharts. You can use basic shapes such as rectangles, diamonds, and circles to represent different steps and decisions in your process. You can also use symbols such as arrows and connectors to show the direction of the flowchart.
Next, you can start adding shapes to your page. To add a shape, simply select it from the Shapes panel and drop it onto the page. You can then use the Connector tool to draw flowlines between shapes. To do this, select the Connector tool and click on the first shape. Drag the line to the second shape and release the mouse button to create the connection. You can also double-click the line to add a text label or change its appearance.
When you have finished creating the flowchart, you can name each shape and connector to provide more clarity and context. Simply select a shape or connector, right-click, and choose the “Add Text” option. You can then type in the name or description of the shape. Repeat this step for all the relevant shapes and connectors in your flowchart.
In total, the process of creating a flowchart diagram involves the following steps: start by opening Microsoft Visio and creating a new page, select the shapes you want to use, add shapes to the page, connect the shapes using flowlines, and name each shape and connector. By following these steps, you can create a visual representation of your processes or business workflows in a clear and organized manner.
How to draw a flowchart
Flowcharts are a visual representation of a process or workflow, often used in business and management to document and communicate a series of steps or processes. Drawing a flowchart is a simple and effective way to visually represent a process or a set of steps. In this article, we will discuss how to draw a flowchart using Microsoft Visio, a professional diagramming tool that is widely used for creating flowcharts and other diagrams.
When creating a flowchart, it is important to first identify the steps or processes that need to be included in the diagram. Start by naming each step or process and then add them to the flowchart diagram. You can use basic shapes such as rectangles, ovals, or diamonds to represent each step or process. To draw the shapes in Visio, select the “Basic Flowchart Shapes” or “Flowchart Shapes” template from the template gallery.
Next, you will need to connect the steps or processes in the flowchart. A flowline or connector is used to connect the shapes in the flowchart. To add a connector in Visio, select the Connector tool from the toolbar and then click and drag between the shapes you want to connect. You can adjust the direction and style of the connector by selecting it and using the options available in the toolbar.
When drawing a flowchart, you may also want to add text to the shapes to provide additional information or clarify the purpose of each step or process. To add text to a shape in Visio, simply select the shape and start typing. You can also format the text using the options available in the toolbar.
Once you have finished drawing the flowchart, you can add a start and end shape to indicate the beginning and end of the process. You can use the “Flowchart” or “Basic Flowchart Shapes” template to add these shapes. If you want to add more shapes or connectors to the flowchart, simply drag and drop them onto the page.
Visio also provides a variety of templates and shapes for specific business processes such as TQM (Total Quality Management) or group decision-making. These templates and shapes can be found in the template gallery and can be used to create flowcharts that are tailored to specific business needs.
Drawing a flowchart can be a useful tool for visualizing and documenting a process or workflow. By following these basic steps and using the features available in Microsoft Visio, you can create professional-looking flowcharts that effectively communicate your ideas and processes.
Create a flowchart
To create a professional flowchart, follow these steps:
- Start with a new document: Open a blank page in a software tool like Microsoft Visio or Visual Paradigm.
- Select a flowchart shape: Choose the shape that represents the process or step you want to add in your flowchart. Common shapes include rectangles, ovals, diamonds, and parallelograms.
- Draw the shape: Use your mouse or trackpad to draw the shape onto the page. For more precise positioning, you can use the arrow keys on your keyboard.
- Add a name or description: Double-click on the shape and type in a name or description for the process or step.
- Connect shapes: To connect multiple shapes, select a connector or flowline from the toolbar and drag it to the desired shape. Then, drop the connector onto the shape to create a connection.
- Continue adding shapes and connectors: Repeat steps 2 to 5 for each process or step you want to include in your flowchart.
- Arrange the flowchart: Move and align the shapes to create a logical flow from one process to the next. Use the connector lines to indicate the direction of the flow.
- Review and finalize: Check the flowchart for accuracy and completeness. Make sure all the steps are in the correct order and that the flow makes sense. Add any additional text or annotations as needed.
- Save and share: Save your finished flowchart to your desired location. You can now share it with your team or use it for any business or management purposes.
By following these steps, you can create a high-quality flowchart that visualizes your business processes or any other flow you want to represent. Whether you are using Microsoft Visio, Visual Paradigm, or any other flowchart tool, the basic process of creating a flowchart remains the same.
How to add text to the flowchart connector or flowline
When creating a flowchart diagram, it is often necessary to add text to the connectors or flowlines that connect different shapes or processes. This can help provide additional information or clarify the flow of the diagram. In Microsoft Visio, a popular tool for creating flowchart diagrams, adding text to connectors or flowlines is a simple process.
Here are the steps to add text to a flowchart connector or flowline in Visio:
- Select the flowchart diagram where you want to add the text.
- Start by creating the shapes or processes that you want to connect with the flowline. You can use basic shapes like rectangles or ovals to represent different steps in a process.
- Next, select the Connector tool from the toolbar. This tool is represented by a line with a right-angle shape at one end, indicating the direction of the flow.
- Click on the first shape or process where you want to start the flow. Then, click on the second shape or process where you want to end the flow.
- A connector will be created between the two shapes, showing the flow direction. By default, the connector will have a straight line shape.
- With the connector selected, go to the Shape Format tab, which will appear on the Ribbon when the connector is selected.
- In the Shape Format tab, locate the Text group. This group contains options for adding text to the connector.
- Click on the “Add Text” button in the Text group. This will insert a text box onto the connector.
- Edit the text box by typing in the desired text. You can also change the font, size, and formatting of the text using the options available in the Font group.
- Once you have finished editing the text, click outside the text box to apply the changes.
Following these steps will allow you to add text to the flowchart connector or flowline in your diagram. The text can be used to label the flow, provide additional information, or name the process it represents. This can be particularly useful in business or professional diagrams, where clarity and visual representation are crucial for effective communication.
TQM Diagram – Professional Total Quality Management →
To start creating a TQM (Total Quality Management) diagram in Microsoft Visio, you will need to open a new page. Select the “Flowchart” template under the “Business” category. This will create a blank page with a set of shapes and connectors that are commonly used in flowchart diagrams.
To draw a shape, select the shape you want from the shape group in the Visio toolbar, then click and drag onto the page where you want to place the shape. To add text to the shape, double-click on it and type the desired text.
To connect shapes, select the “Connector” tool from the toolbar. Click on the first shape and drag the cursor to the second shape. A connector line will be automatically created to show the flow of the process or information from one shape to another.
When you have finished drawing the basic TQM diagram, you can add connectors to connect the shapes and create a flowline through the flowchart. To do this, select the “Connector” tool again and click and drag the cursor onto the next shape to connect them.
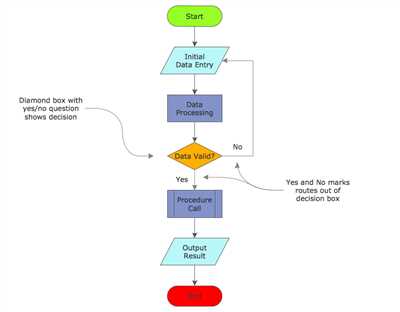
In the TQM diagram, there are several key shapes that you can use to represent specific business processes. These shapes include the start/end shape, the process shape, and the decision shape. Each shape has a specific meaning and can be customized to fit your needs.
To create a professional-looking TQM diagram, you can also use pre-made shapes and connectors from the Visio shapes palette. Simply select the shape you want, drag it onto the page, and then connect it to other shapes using connectors.
Remember to name each shape and connector using meaningful labels that describe their purpose and function. This will help you and others understand the flow and logic of the TQM diagram.
Once you have finished creating the TQM diagram in Visio, you can export it to Microsoft Excel or save it as an image or PDF file for further use or sharing.
The TQM diagram is a visual representation of the total quality management paradigm. It helps businesses identify and improve their quality management processes, ensuring that customers receive high-quality products and services.
Follow these steps to create a TQM diagram in Microsoft Visio and start your journey towards professional total quality management.
→ Click here to see a visual example of a TQM diagram.
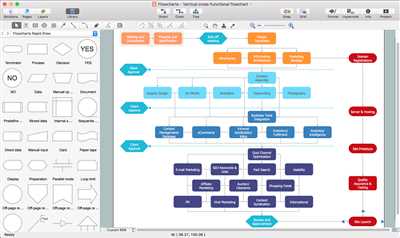
Creating a Flowchart in Visual Paradigm
To add flowchart shapes and connectors to your diagram in Visual Paradigm, follow these steps:
- Select the “Diagram > New” option from the menu. In the New Diagram window, select “Flowchart Diagram” under the “Business Process Modeling” section, and then click “Next”.
- Give your flowchart a name and select the page size that you want to use. You can also choose to start with a template or a blank page. Click “Next” when finished.
- In the drawing page, you will find a basic set of flowchart shapes and connector types available in the Shape Library. You can drag and drop these shapes onto the page to create your flowchart. To add text to a shape, simply double-click on the shape and type the desired text.
- To connect the shapes, select the “Line” tool from the toolbar. Click on the starting shape, then click at the end point of the connection line. Follow the same steps to add flowlines for other shapes in the flowchart.
- If you need to add more shapes or connectors, you can find them in the Shape Library. To add a connector, simply drag it onto the page and connect it to the desired shapes.
- Use the “Group” function to group shapes together or the “Ungroup” function to break them apart.
- When you are finished creating your flowchart, you can save it as an Excel, Visio, or Visual Paradigm file by selecting the “File > Save As” option from the menu.
By following these steps, you can create a flowchart in Visual Paradigm with ease. Visual Paradigm offers a professional visual diagramming tool that simplifies the process of creating flowcharts for business process management, TQM, or any other type of process you need to diagram.
Next, we will look at how to draw flowchart diagrams using Microsoft Visio.