
If you’re working on a project that requires you to visually represent the flow of information, processes, or operations, you may find yourself needing to create a flow diagram. Flow diagrams, also known as flowcharts, are graphical representations of a system’s structure and its flow of data or activities. They are used in various fields such as software development, business analysis, and project management to document and visualize complex processes.
There are several types of flowcharts, such as the Data Flow Diagram (DFD), Process Flow Diagram (PFD), and Unified Modeling Language (UML) diagrams, each with its own specification and purpose. The most commonly used type of flowchart is the DFD, which shows how data flows through a system. On the other hand, a PFD is used to show the flow of physical materials or energy, while UML diagrams are used for modeling and analysis of software systems.
When you start creating a flow diagram, the first thing you should do is determine which type of flowchart best suits your needs. Consider the nature of your project and what you want to show in the diagram. If you’re working on a software development project, a DFD may be the best choice to visualize the flow of data and operations. If you’re documenting a manufacturing process, a PFD may work well to show the movement of materials through a production chain.
Once you’ve chosen the type of flowchart you want to create, you can start drawing the flow diagram. There are many tools available that can help you with this task. One such tool is EdrawMax, which provides a wide range of shapes, connectors, and pre-made libraries to assist you in creating flowcharts. You can use this software to generate flowcharts in various formats, including PDF, JPG, and HTML. It also offers built-in templates and examples that you can use as a reference.
Before you start drawing the flowchart, take some time to thoughtfully consider the structure and hierarchy of the system you’re documenting. Identify the main components, the paths of data or activities, and any decision points or operations that need to be represented. This will ensure that your flow diagram accurately reflects the workflow of the system.
When drawing the flow diagram, use appropriate shapes and connectors to represent different components and their connections. For example, use rectangles to represent processes or activities, diamonds for decision points, and arrows to show the flow of data or actions. You can also use swimlane diagrams to show the flow of work between different departments or stakeholders.
As you work on your flow diagram, remember to include clear and concise descriptions for each component and connector. This will help others understand the flowchart, especially if they’re not familiar with the system or the specific terminology used. Use labels or annotations to provide additional information or explanations.
Finally, when you’re done drawing the flow diagram, step back and take a final snapshot of your work. Review the diagram to ensure that it accurately represents the system and its workflow. Check for any errors or inconsistencies, and make any necessary revisions. Remember, flow diagrams are meant to clarify and simplify complex processes, so they should be easy to understand and follow.
By following these steps and using the right tools, you can efficiently draw flow diagrams that effectively communicate the flow of information, processes, or operations. Whether you’re creating a flowchart for a software development project or documenting a manufacturing process, flow diagrams can help you visualize and understand the inner workings of a system.
- Flow Diagrams
- What is a flow diagram Our definition
- 1 Data flow diagram (DFD)
- 2 Workflow diagram
- 3 Swimlane flowchart
- 4 Process flow diagram PFD
- 5 Event-driven process chain EPC
- 6 Specification and description language diagram SDL
- 7 Unified modeling language diagram UML
- Show hierarchy in data flow diagrams
- Final Thoughts
- Sources
Flow Diagrams
A flow diagram, also known as a flowchart, is a visual representation of the movement of data, processes, or actions within a system. It is a helpful tool for understanding and analyzing a process or system, as it shows the sequence of steps and the relationships between them.
There are various types of flow diagrams, including structured flowcharts, unified modeling language (UML) diagrams, and data flow diagrams (DFDs), each with their own set of symbols and connectors. Depending on the type of flow diagram you’re working with, there may be different shapes and symbols used to represent different operations, events, or data sources.
When drawing a flow diagram, it is important to first define the overall process or system you want to represent. This will help you determine the appropriate symbols and connectors to use, as well as the flow of data through various processes. It’s also helpful to have a clear understanding of the purpose of the diagram and the audience it is intended for.
Flow diagrams can be created using various tools and software, such as EdrawMax, which provides templates and shapes for different types of flowcharts. Once you have drawn the flow diagram, you can use it as a reference to understand how the processes and actions within a system work, or generate a final document that can be shared with others.
In a flow diagram, each step of the process is represented by a shape or widget, such as a rectangle or circle, and is connected through arrows or lines. The flow of the process is shown from the starting point to the endpoint, indicating the movement of data or actions. In some flow diagrams, swimlane or swimmer shapes may be used to show the roles or responsibilities of different individuals or departments involved in the process.
Flow diagrams are used in a variety of fields, including software development, project management, and business analysis. They can be a useful tool for visualizing and documenting complex processes, as well as identifying bottlenecks or inefficiencies. Whether you’re analyzing a current process or designing a new one, a flow diagram can help you understand the flow of data and actions more clearly.
Overall, flow diagrams are a valuable tool for representing the movement of data, processes, or actions within a system. They provide a snapshot of the entire flow and can be used to analyze, design, and document various processes. By understanding different types of flow diagrams and being familiar with the symbols and connectors used, you can draw flow diagrams that effectively communicate your thoughts and specifications.
What is a flow diagram Our definition

A flow diagram is a visual representation of a process or workflow that shows the movement of data, actions, and decisions through various processes. It is a useful tool for understanding and documenting the flow of information within a system or organization.
Flow diagrams come in different types and formats, such as flowcharts, Data Flow Diagrams (DFD), Unified Modeling Language (UML) diagrams, Event-Driven Process Chain (EPC) diagrams, and more. Each type has its own specific purpose and can be used to represent different aspects of a process.
A flow diagram provides a snapshot of the entire process, giving a clear and concise description of how the system or workflow works. It helps users to understand the chain of operations and interactions between different entities involved in a process.
Flow diagrams are typically represented using shapes and arrows to show the flow of data and actions. For example, a flowchart uses different symbols to represent different types of actions or decisions, while a swimlane diagram uses horizontal or vertical lanes to represent different entities or roles involved in a process.
When creating a flow diagram, you should keep in mind the purpose and audience for whom it is intended. The diagram should be clear, easy to understand, and generate a visual reference for the workflow or process being described.
Flow diagrams have been widely used in various industries and domains, such as software development, business process modeling, system analysis, and more. They provide a visual representation of complex processes, making it easier to identify bottlenecks, gaps, or areas for improvement.
In conclusion, a flow diagram is a valuable tool for visualizing and understanding the flow of data, actions, and decisions in a process or workflow. It helps to simplify complex information and provides a clear representation of how things work.
1 Data flow diagram (DFD)
A Data Flow Diagram (DFD) is a graphical representation of the flow of data within a system. It shows how data moves from one process to another and the interactions between different processes. DFDs are useful for visualizing and understanding the structure and functionality of a system.
In a DFD, the movement of data is represented by arrows, which indicate the flow of information. The processes are represented by circles or rectangles, and the data stores are represented by rectangles with parallel lines. The connectors, such as circles or squares, are used to show how data flows between processes, data stores, and external entities.
There are various types of DFDs, such as context-level DFDs, level 0 DFDs, and level 1 DFDs. The context-level DFD provides a broad overview of the entire system, while the level 0 DFD shows the main processes and data flows. The level 1 DFD provides a more detailed view by breaking down the main processes into sub-processes.
To draw a DFD, you can use tools like EdrawMax, which provide pre-built widgets and templates for creating DFDs. Start by creating a new page for your DFD diagram. Then, use the widgets to draw the processes, data stores, and connectors. Connect the processes and data stores using the appropriate connectors, and add descriptions or specifications for each element.
When creating a DFD, it’s important to keep the diagram well-structured and organized. Use clear labels and icons to represent the processes and data flows. Make sure to choose the appropriate symbols and connectors for your DFD. Also, use a consistent naming convention for processes and data stores to make the diagram easier to understand.
DFDs can be helpful in understanding and documenting the flow of data in a system. They can be used as a reference for developers and stakeholders to understand the system’s functionality and interactions. DFDs can also be used to generate other diagrams, such as flowcharts or UML diagrams, which show the detailed processes and operations of a system.
In conclusion, a Data Flow Diagram (DFD) is a useful tool for modeling the flow of data within a system. By using DFDs, you can show how data moves through processes and data stores, and understand the interactions between different components of the system.
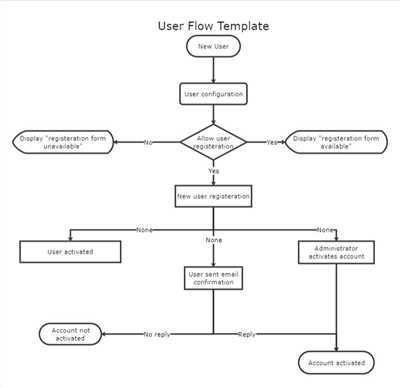
2 Workflow diagram
A workflow diagram is a visual representation of the steps and processes involved in a unified system or project. It is often used to define the structure and flow of events in an event-driven system. There are various tools available, such as EdrawMax, that can be used to draw workflow diagrams.
Workflow diagrams are useful in many ways. They can be used to create PFDs (Process Flow Diagrams) to show the movement of data and information through a system. They can also be used to create flowcharts and swimlane diagrams to show the flow of operations and activities in a user-friendly manner.
In a workflow diagram, you can use various symbols and widgets to represent different types of actions, decision points, and paths. For example, you can use rectangles to represent processes or tasks, diamonds to represent decision points, and arrows to represent the flow of information or movement between different tasks.
When drawing a workflow diagram, you should start with a clear definition and specification of the system or process you want to model. This will help you choose the most appropriate symbols and flowchart types for your diagram.
There are different ways to represent workflow diagrams, but one of the most commonly used formats is the swimlane diagram. In this type of diagram, each page represents a specific role or department, and the flow of tasks and information is shown through the corresponding swimlanes.
When creating a workflow diagram, it is important to keep it well-organized and easy to understand. You should use clear labels and descriptions for each symbol and action, and make sure the flowchart follows a logical and sequential order.
There are various sources where you can find templates, examples, and tutorials to help you learn how to draw a workflow diagram. Many of these resources provide step-by-step instructions and visual snapshots of the process, which can be very helpful when you’re first starting out.
In conclusion, a workflow diagram is a visual representation of a system or project’s process flow. It uses symbols and widgets to represent different types of actions, decision points, and paths. Workflow diagrams can be used for analysis, modeling, and system specification, and they’re most commonly used in event-driven and user-friendly systems.
3 Swimlane flowchart
A swimlane flowchart is a type of process flow diagram that organizes information into multiple lanes or columns, typically representing different departments or individuals involved in a process. This flowchart structure is commonly used in business process modeling to show the sequence of activities and the interaction between different stakeholders.
When creating a swimlane flowchart, you will first need to determine the hierarchy and decision points within the process. Some of the most common swimlane flowchart symbols used include rectangles to represent process steps or actions, diamonds to represent decision points, and arrows to indicate the flow of information or movement through the diagram.
In a swimlane flowchart, each swimlane corresponds to a specific department or individual responsible for performing a certain set of tasks. For example, in a software development project swimlane flowchart, you may have swimlanes for requirements gathering, design, development, testing, and deployment. Each swimlane will include the corresponding tasks and actions performed by the individuals or departments.
To draw a swimlane flowchart, you can use various diagramming tools and software, such as EdrawMax, where you can choose from a library of pre-designed swimlane flowchart symbols and connectors. This makes it easier to create structured and organized swimlane flowcharts.
The swimlane flowchart is particularly useful when you want to visualize workflows, understand the interaction between different departments or individuals, and keep track of the overall progress of a process or project. It also helps in documenting and communicating complex processes and identifying areas that need improvement or optimization.
When working with swimlane flowcharts, it is important to ensure that the flowchart is well-organized, the swimlanes are clearly labeled, and the logical flow of the process is easy to follow. Each swimlane should have a clear description of the tasks or actions it represents, and the connectors should be used to show the flow of information or movement between different swimlanes or steps.
In summary, swimlane flowcharts are a useful tool for visualizing and organizing complex processes. They provide a clear structure and hierarchy, making it easier to understand how different departments or individuals interact with each other and contribute to the overall process. Whether you are designing a workflow for a new system or documenting an existing process, swimlane flowcharts can help you generate a structured and comprehensive diagram.
4 Process flow diagram PFD
A Process Flow Diagram (PFD) is a type of workflow diagram that is used to show a visual representation of the different processes and actions that happen within a system. It is a helpful tool for both documenting and understanding the structure and hierarchy of a process.
PFDs are often used in project analysis and system modeling to generate a snapshot of the various operations and paths that a system can take. They can be structured in different ways, such as swimlane diagrams or flowcharts, depending on the type of information and interactions that need to be shown.
There are several types of PFDs that can be used, including UML diagrams, SDL diagrams, and even decision trees. Each type has its own specific purpose and can be chosen based on the needs of the project or analysis.
When drawing a PFD, it is important to keep in mind that the goal is to create a clear and easy-to-follow diagram that shows the flow of processes and actions. This can be done by using shapes and arrows to represent the different steps and movements within the process.
It is also important to provide a clear definition or description of each process or action that is shown in the PFD. This will help ensure that everyone who views the diagram understands what is happening at each step.
In summary, a Process Flow Diagram (PFD) is a valuable tool for visualizing and understanding the flow of processes and actions within a system. By using different types of PFDs, such as flowcharts or swimlane diagrams, you can effectively communicate complex information and help facilitate effective decision-making.
5 Event-driven process chain EPC

An Event-driven Process Chain (EPC) is a type of flow diagram used to visualize and document business processes. It is a structured modeling technique that represents the flow of operations and interactions between various entities within a system or organization.
EPCs are useful for analyzing and understanding the flow of information, as well as the actions and decisions that happen within a process. They can be used to generate a snapshot of the workflow, showing how data and information move through different stages of the process.
When drawing an EPC, you will use different symbols and connectors to represent the various types of flows and interactions. Each symbol has a specific meaning and helps you to keep the structure of the diagram well defined and organized.
The EPC diagram should provide a clear description of each process and how it connects to the others. It should also provide a reference for each process, which can be useful when documenting and communicating about the project or system.
There are several libraries and tools available to draw EPC diagrams, such as SDL Thought’s process modeling widget or the DFD and EPC libraries in some flowchart drawing software. You can choose the one that best fits your needs and the level of complexity of your analysis.
Some key elements and symbols used in EPC diagrams include:
1. Events: Represents something that happens in the system, such as the start or end of a process.
2. Functions: Represents the actions or operations that occur within a process.
3. Logical operators: Represent decision points or conditions within a process.
4. Connectors: Used to connect different symbols and represent the flow of information or the interaction between different processes.
5. Information: Represents the data or information that is being processed or manipulated within a process.
By using EPC diagrams, you can create a visual representation of your workflow and help others understand the process and its interactions. It is a helpful tool in both analysis and documentation of your project or system.
6 Specification and description language diagram SDL
The Specification and Description Language (SDL) diagram is a modeling language used to document system specifications and describe the behavior of systems. It is a graphical language that uses symbols, connectors, and actions to represent processes, data flows, and movement within a system.
SDL diagrams can be helpful in both the analysis and design phases of a project. They provide a structured way to document the flow of information and the decision-making process within a system. SDL diagrams can be used to draw flowcharts, process flow diagrams (PFD), or even Unified Modeling Language (UML) diagrams.
When using SDL diagrams, it is important to define the types of symbols and connectors that will be used. Each symbol and connector represents a specific action or process within the system. For example, there are symbols to represent data sources, processes, and final outputs. Connectors show the paths through which data flows.
There are various formats that can be used to draw SDL diagrams. Some of the most common are swimlane diagrams, which show the flow of information through different user or system roles, and structured diagrams, which provide a snapshot of the system at a specific point in time.
A SDL diagram typically consists of pages that show different aspects of the system, such as the system’s overall structure, the flows of data through the system, and the actions or processes that happen within the system. The diagrams should be used as a reference document, providing a clear and concise description of how the processes and flows within the system work.
SDL diagrams can be used in both software development and other systems engineering contexts. They can be used to document and model both the physical and logical aspects of the system. They help to define the boundaries of the system and the interactions between different components. SDL diagrams can also be used to help with system analysis and requirements definition.
Overall, SDL diagrams are a useful tool for documenting and describing the behavior of systems. They provide a clear and visual representation of how a system’s processes and flows work, making it easier to understand and communicate complex information. Software such as EdrawMax can be used to draw SDL diagrams in a variety of formats and styles, making it an excellent choice for creating SDL diagrams.
7 Unified modeling language diagram UML
The Unified Modeling Language (UML) is a modeling language that is commonly used in software development to visually represent different aspects of a system. UML diagrams provide a standardized way to communicate and document the various components, processes, and relationships within a system.
There are several types of UML diagrams, each of which serves a different purpose in modeling systems. Here are some of the most commonly used UML diagrams:
- Class Diagram: This type of diagram is used to represent the structure of a system, including classes, attributes, operations, and their relationships.
- Use Case Diagram: This diagram shows the interactions between a system and its users, depicting the various use cases and their relationships.
- Sequence Diagram: Sequence diagrams illustrate the flow of messages and interactions between objects or classes in a system.
- Activity Diagram: Activity diagrams represent the flow of activities or actions within a system, showing the different states and transitions.
- Statechart Diagram: Statechart diagrams model the states and transitions of an object or a system, capturing different behaviors and events that can happen.
- Component Diagram: Component diagrams depict the physical components or modules that make up a system and their relationships.
- Deployment Diagram: Deployment diagrams show the physical placement of system components, such as computers, networks, and devices.
Each UML diagram has its own set of symbols and notations that represent different elements and relationships. These symbols and notations make it easier to understand the structure and behavior of a system documented in UML diagrams. However, it is important to note that UML is a specification language, and different modeling tools may have slight variations in the symbols and notations they use.
If you want to draw UML diagrams, you can choose from a variety of software tools that support UML modeling. Some popular options include EdrawMax, Lucidchart, and Visual Paradigm. These tools offer features that allow you to create and customize UML diagrams, generate code from your models, and collaborate with other team members.
In summary, UML diagrams are a valuable tool for modeling and documenting software systems. They provide a visual representation of the system’s structure, behavior, and interactions, making it easier to understand and communicate complex ideas. By using UML diagrams, you can create a comprehensive and structured documentation of your project, enabling a better analysis and understanding of the system.
Show hierarchy in data flow diagrams
Data flow diagrams (DFDs) are powerful tools used in system analysis and design to visually represent the flow of information and processes within a system. They provide a clear and structured representation of how data moves through a system, making it easier to understand the system’s operations and interactions.
One important aspect of creating effective DFDs is to show the hierarchy of data and processes. This helps to provide a better understanding of the system’s structure and how the different components are interconnected.
In a DFD, each process or data store is represented as a shape or symbol. The most common symbols used for processes are circles or ovals, while rectangles or squares are used for data stores. Arrows or connectors are used to show the movement of data between processes and data stores.
There are several types of DFDs, but the most commonly used ones are the context diagram (Level 0 DFD) and the level 1 DFD. The context diagram provides an overview of the entire system, while the level 1 DFD provides a more detailed view of the system by breaking down the processes into smaller subprocesses.
To show hierarchy in DFDs, you can use different levels of detail. For example, you can use a level 1 DFD to represent the main processes of the system, and then use level 2 DFDs to represent the subprocesses within each main process. This allows for a better understanding of the system’s structure and the relationship between its components.
Another way to show hierarchy in DFDs is to use numbering or naming conventions. For example, you can number the processes and data stores in a hierarchical manner, such as 1.0, 1.1, 1.2 for the main processes and 1.1.1, 1.1.2 for the subprocesses. This helps to clearly define the hierarchy and the relationship between the different components.
It is also helpful to use colors or shading to differentiate between levels of detail in the DFD. For example, you can use different colors for the main processes, subprocesses, and data stores. This visually distinguishes the different levels of the hierarchy and makes it easier to understand the DFD.
In summary, showing hierarchy in data flow diagrams is essential to effectively model and analyze systems. By using different levels of detail, numbering or naming conventions, and visual cues, you can create DFDs that clearly represent the hierarchical structure of a system and help stakeholders understand how data flows through it.
Final Thoughts
In conclusion, flow diagrams are a helpful tool for visualizing and understanding the flow of operations within a system or workflow. They can be used to generate a hierarchical structure that corresponds to the chain of events or actions in a given process. Whether you want to draw a simple flowchart or a more complex swimlane diagram, there are various types and formats to choose from.
When creating flow diagrams, it is important to keep in mind the type and purpose of the diagram. Flowcharts are useful for providing a snapshot of the entire process, while specific diagrams like the UML or DFD can provide a more detailed description of the system’s operations and data flows.
There are many tools available to help you draw flow diagrams, such as EdrawMax, which provides a wide range of widgets and connectors to create the structure you need. These tools make it easy to connect shapes and widgets to represent the flow of information and decision points in your process.
It is also important to understand the different types of connectors used in flow diagrams. For example, in a swimlane diagram, connectors can indicate the interaction between different systems or departments. By using the appropriate connectors, you can ensure that your flow diagram accurately represents the flow of information or actions.
Final thoughts, if you’re new to drawing flow diagrams, it’s helpful to learn from examples and reference sources like the IDEF0, SDL, or EPC notations. These resources can provide guidance on which type of diagram to use for a specific analysis or workflow. It’s also important to consider the audience and purpose of your diagram when choosing the best format.
In summary, flow diagrams are a valuable tool for understanding and documenting workflows and systems. By using the right diagrams and connectors, you can create a visual representation that is both clear and informative. Whether you’re creating a simple flowchart or a complex swimlane diagram, keeping these considerations in mind will help ensure that your flow diagram accurately represents the process or workflow you’re documenting.
Sources
When it comes to drawing flow diagrams, it’s important to know where to find the necessary information and resources. Here are some useful sources to help you understand the operations and symbols used in flowcharting:
- Flowcharting basics: Learn the basic concepts of flowcharting and how to draw flow diagrams. This will give you a good foundation to start with.
- Flowchart symbols: Familiarize yourself with the various symbols used in flowcharting. Each symbol has a specific meaning and is used to represent different actions or steps in a process.
- Flowchart types: Understand the different types of flowcharts, such as process flowcharts, data flowcharts, and decision flowcharts. Each type is used in a specific context and helps in analyzing and representing different aspects of a system or process.
- Flowchart examples: Find examples of flowcharts to get a better idea of how they are used in different industries and scenarios. This will help you generate ideas and understand how to adapt flowcharting to your specific needs.
- Flowcharting tools: Explore software and online tools that can help you draw flowcharts more efficiently. There are various formats and systems available, such as UML, BPMN, and EPC, each with its own set of features.
- Flowcharting best practices: Learn tips and techniques for creating effective flowcharts. Understand how to structure your flowchart, use connectors, and choose the right symbols for your needs.
- Flowcharting techniques: Dive deeper into advanced flowcharting techniques, such as swimlane diagrams, event-driven flows, and hierarchy chains. These techniques can be used to model complex processes and interactions.
- Flowcharting for analysis: Understand how flowcharts can be used as a tool for process analysis and improvement. Learn how to identify bottlenecks, inefficiencies, and areas for optimization in your workflow.
- Flowcharting resources: Find additional resources and references on flowcharting. These can include books, articles, online tutorials, and communities where you can find help or share your thoughts with others.
By keeping these sources in mind, you will be well-equipped to create clear and informative flow diagrams for your projects and work.