
Infographics are an effective way to tell a story and engage your audience. Instead of making your readers read through wordy paragraphs of information, you can present them with a concise and visually appealing infographic that will grab their attention and increase traffic to your website. In this article, we will explore how to create infographics that not only educate but also entertain and share insights.
Before we dive into the ways to create infographics, let’s first understand what they are and why they are important. Infographics are visual representations of data, information, or concepts. They help people better understand complex information by breaking it down into simple and easy-to-digest visuals. Infographics can be created using various design tools and can be shared on social media, websites, or even in video format.
When creating infographics, it is important to know your audience and what information or insights they might be looking for. This will help you choose the most relevant data and design elements to include in your infographic. You should also consider your branding and use colors, fonts, and design styles that align with your brand’s identity.
Now that you know why infographics are important and how they can help drive traffic to your website, let’s check out some tips on how to create engaging infographics. First and foremost, make sure your infographic has a clear and concise story or concept. This will help your readers understand the main idea and follow the flow of information within the infographic. You can use headings, subheadings, and bullet points to make the content more organized and easy to read.
- How To Create Infographics
- Why create infographics
- Engage with your audience
- Help your readers understand the data
- Drive traffic to your website
- Adioma
- How to Create an Infographic
- Step 1: Define Your Goal
- Step 2: Research and Gather Relevant Data
- Step 3: Plan Your Story or Message
- Step 4: Design the Infographic
- Step 5: Visually Display Information
- Step 6: Engage and Educate Your Audience
- Step 7: Share and Increase Traffic
- Step 8: Check the Impact and Make Improvements
- Sources
How To Create Infographics
Infographics are an effective way to visually display information and engage your audience. With the help of fonts, colors, and design concepts, you can create compelling and informative designs that will drive traffic to your website or social media platforms. Here are some steps to follow for creating impactful infographics:
1. Define Your Goal: Before you start designing your infographic, determine what the main objective is. Are you trying to educate your readers, increase brand awareness, or tell a story? Knowing your goal will help you structure your infographic accordingly.
2. Gather Relevant Data: To create an informative infographic, you need to have accurate and interesting data. Research reliable sources and collect the information you want to share with your audience. Make sure the data is organized and easy to understand.
3. Tell a Story: Infographics are a great way to convey a story or narrative. Instead of presenting data in a wordy format, try to connect the information in a way that flows logically and engages the readers. Use visuals, such as icons or illustrations, to enhance the storytelling aspect.
4. Design the Infographic: When designing your infographic, keep in mind that simplicity and conciseness are key. Avoid overcrowding the design with too much information or unnecessary elements. Use colors that are visually appealing and consistent with your branding.
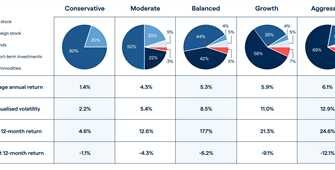
5. Use Visuals to Enhance Understanding: Infographics are meant to simplify complex information, so use visuals to help your audience understand the data more easily. Create charts, graphs, or diagrams that illustrate the key points effectively.
6. Include Call-to-Action: Infographics can be a powerful tool to drive traffic to your website or social media platforms. Include a link or a call-to-action within the infographic to encourage people to learn more or share the content with others.
7. Share Your Infographic: Once your infographic is created, share it on your website, blog, or social media platforms. Consider creating a video version of the infographic, as videos often have a higher engagement rate.
Remember, the most important thing when creating infographics is to provide valuable and relevant information to your audience in an engaging and easy-to-understand way. By following these steps, you can create impactful infographics that will increase brand awareness and drive traffic to your platforms.
Why create infographics
Infographics are a powerful way to educate and engage with your audience. Instead of making your website visitors read through lengthy paragraphs of text, infographics allow you to share relevant information and insights in a visually appealing and concise manner.
When it comes to storytelling, infographics can turn complex or hard-to-understand data into simple and captivating visuals. By using colors, fonts, and design elements to display information, you can help your readers better understand and remember the concept you’re trying to convey.
Furthermore, infographics can have a significant impact on your branding and website traffic. People are more likely to engage with and share visually appealing content, increasing the chances of your infographics being shared on social media platforms, driving more traffic to your website.
By creating infographics, you can also increase your chances of attracting backlinks from other websites. When you have visually appealing and valuable infographics, other websites might link back to them, giving you additional exposure and increasing the credibility and authority of your website.
One of the most important reasons why you should create infographics is that they help you communicate complex information in a simple and understandable way. You can break down complex ideas or processes into simple steps or visuals, making it easier for your audience to grasp the information and remember it.
Additionally, infographics provide a more engaging experience for your website visitors. Instead of presenting them with a wall of text, you can present the information in a visually appealing format, capturing their attention and encouraging them to explore further.
Infographics can also help you tell a story. By structuring your information in a logical and visually appealing way, you can create a narrative that guides your readers through the data and insights you’re presenting. This storytelling aspect can make your content more memorable and impactful.
Lastly, infographics have the potential to go viral. When you create visually appealing and shareable designs, people are more likely to share them on social media platforms, increasing your brand visibility and reach to a wider audience.
In conclusion, infographics can help you educate, engage, and drive traffic to your website. They allow you to present information in a visually appealing and concise manner, making it easier for your audience to understand and remember. Infographics also have the potential to increase your brand exposure and bring valuable backlinks to your website. So, instead of relying on wordy paragraphs, consider creating infographics to effectively communicate your message and capture the attention of your audience.
Engage with your audience
When it comes to creating infographics, one of the main goals is to engage with your audience. A well-designed and visually appealing infographic can capture the attention of website visitors and help them understand complex information in a simpler way.
Instead of bombarding people with wordy and lengthy explanations, infographics use visuals and concise storytelling to educate and engage. This can have a significant impact on your branding and drive traffic to your website.
So, how can you create an engaging infographic that resonates with your audience? Here are some ways:
1. Know your audience: Before making an infographic, it is crucial to understand who your target audience is and what kind of information they are looking for. This will help you tailor your infographic to their needs and interests.
2. Keep it simple: Infographics should be simple and easy to read. Avoid using complex designs, fonts, and colors that might confuse or overwhelm your audience. Stick to a minimalistic design that focuses on the key concepts and information you want to convey.
3. Tell a story: Humans are wired to respond to stories, so try to incorporate a narrative element into your infographic. This will make it more engaging and memorable for your audience.
4. Provide relevant insights: Infographics are a great way to present data and insights in a visually appealing format. Make sure the information you include is relevant and provides value to your audience.
5. Link to reliable sources: If you’re using data or statistics in your infographic, always cite the sources. This will increase the credibility of your content and show that you’ve done your research.
6. Share your infographic: Once you’ve created an engaging infographic, don’t forget to share it with your audience. Post it on your website, social media, or even embed it within a blog post. This will help you reach more people and increase the chances of your infographic being read and shared.
By following these tips, you’ll be able to create infographics that not only inform but also engage your audience. Remember, the goal is to turn complex data and information into visually appealing and easily digestible content that resonates with your readers.
Help your readers understand the data
When it comes to presenting data on your website, you want your readers to easily understand what you are trying to convey. One effective way to achieve this is by creating infographics.
Infographics are visually appealing and concise designs that make it easier for people to grasp complex information and insights without getting overwhelmed. They combine relevant data, images, and text to tell a story in a visually engaging way.
By making your data more visually appealing, you can help educate your audience and increase their engagement. Infographics can be used to display information about your brand, products, or services, or they can be used to explain complex concepts and ideas.
Instead of presenting wordy paragraphs or hard-to-understand charts and graphs, you can turn your data into simple and visually impactful designs. This way, your readers can quickly understand the main points and key takeaways without getting lost in the details.
Above all, the goal of an infographic is to help your readers understand the data and insights you are presenting. The design should be clear and easy to follow, with the use of fonts, colors, and adioma all working together to create a cohesive visual experience.
When making infographics, it’s important to keep in mind the needs of your target audience. Ask yourself, “What do my readers need to know?” and “How can I present this information in a way that is both informative and engaging?” By answering these questions, you can ensure that your infographic is relevant and impactful.
Also, consider the social sharing potential of your infographic. If it’s visually appealing and easy to understand, people are more likely to share it on social media platforms, which can drive more traffic to your website and increase brand awareness.
Before creating an infographic, think about the story you want to tell. Identify the most important data points and decide how you want to visually represent them. Then, choose a design concept that aligns with your brand and the message you want to convey.
When it comes to the actual design of your infographic, keep it simple and organized. Avoid cluttering the design with too much information and instead focus on displaying the key points in a clear and concise manner.
Help your readers understand the data by providing a link to the sources you used. This adds credibility to your information and allows interested readers to delve deeper into the topic.
Remember, infographics are a powerful tool to help your audience better understand and engage with data. By following these tips, you can create visually appealing and informative infographics that will capture your readers’ attention and drive more insights.
Drive traffic to your website
Infographics are a powerful tool to drive traffic to your website. With adioma, you can create visually engaging and relevant infographics that display complex data and insights in a simple and concise way. Instead of using wordy and hard-to-understand information, you can turn your story into a visually appealing video or infographic.
When creating an infographic, you should consider your audience. Understand what they know and what they might want to learn. Through storytelling and visual design, you can educate and engage them without overwhelming them with too much text.
One of the most important things to do is to make the design of your infographic visually appealing. Choose colors and fonts that align with your branding and catch the reader’s attention. By using simple and impactful designs, you can increase the chances of your infographic being shared on social media platforms and other online sources.
Above all, your infographic should have a clear goal: to drive traffic to your website. Include a link to your website within the infographic so readers can easily find more information about the topic. By providing valuable content in a visually appealing way, you can attract more visitors to your website and increase the chances of them converting into customers.
If you’re not sure how to create an infographic or where to start, check out the adioma tool mentioned above. It provides templates and easy-to-use tools that can help you create professional-looking infographics in no time.
So, instead of relying solely on text-based content, turn your information into visually engaging infographics to drive traffic to your website. Remember to keep it concise, visually appealing, and relevant to your audience, and you’ll see the impact it can have on increasing your website traffic.
Adioma
Adioma is a great tool for creating infographics that are visually engaging and easy to understand. With Adioma, you can turn complex information into a simple and concise story that will help educate and engage your audience.
One of the most important things to consider when making infographics is the design. Adioma offers a wide range of visually appealing designs, fonts, and colors to choose from. You can customize your infographic to fit your brand’s branding, making it more relevant and impactful.
Adioma also provides insights into how your infographic is performing. You can check the impact of your infographic on your website’s traffic, social media shares, and more. This way, you can know if your infographics are driving the desired results and make any necessary adjustments.
When creating an infographic with Adioma, you should think about the story you want to tell. What information do you want to share with your readers? How can you visually display that information in a way that is easy to understand? Adioma helps you answer these questions and guides you through the process of creating a compelling infographic.
Infographics created with Adioma can help increase traffic to your website. People are more likely to click on a visually appealing and informative infographic than a wordy article. Infographics also tend to be more shareable, which can help increase your brand’s reach and engagement on social media.
So why choose Adioma? With Adioma, you can create visually stunning and informative infographics that engage your audience and help them understand complex concepts without overwhelming them with text. Adioma provides the tools and resources you need to create infographics that make an impact.
If you’re looking for a way to increase traffic, engage your audience, and educate them through visually appealing storytelling, Adioma is the tool for you. Check out Adioma’s website to see what they have to offer and start creating your own infographics today!
How to Create an Infographic
Infographics are a visually appealing and effective way to present information. They can help drive traffic to your website, engage and educate your audience, and increase brand visibility. In this article, we will discuss the steps to create an infographic that will have a strong impact on your readers.
Step 1: Define Your Goal
Before you start making an infographic, you should clearly define the goal you want to achieve. Are you trying to educate your audience, display data insights, or promote a product or service? Knowing your goal will help determine what information and design elements to include in your infographic.
Step 2: Research and Gather Relevant Data
The next step is to gather all the necessary information and data for your infographic. Make sure to use reliable sources and double-check the accuracy of the data you’re using. Organize the information in a concise and easily understandable format.
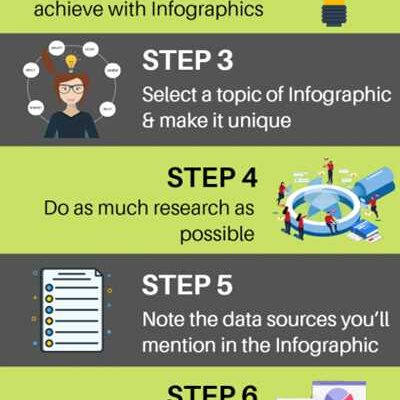
Step 3: Plan Your Story or Message

Once you have your data, you need to turn it into a compelling story or message. Determine the key points you want to convey and create a concept for your infographic. Think about the flow of information and how the different elements will work together to engage your audience.
Step 4: Design the Infographic
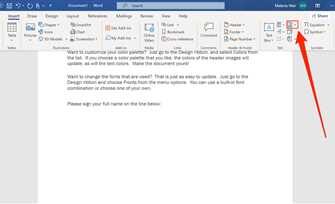
When designing your infographic, keep in mind that simplicity is key. Avoid making it too wordy or cluttered with unnecessary details. Use colors, fonts, and visuals that are consistent with your brand’s visual identity. You can use design tools like Adobe Illustrator or Canva to create visually appealing designs.
Step 5: Visually Display Information
One of the primary purposes of an infographic is to visually display information. Use charts, graphs, icons, and illustrations to represent data and concepts. Make sure the visuals are clear and easy to understand at a glance.
Step 6: Engage and Educate Your Audience

An infographic should not only be visually appealing but also engage and educate your audience. Use storytelling techniques to guide your readers through the information and help them understand the key insights you’re providing. Make sure the content is concise and easily digestible.
Step 7: Share and Increase Traffic
Once your infographic is created, share it on your website, blog, and social media platforms. Instead of simply linking to the infographic, consider embedding it directly into your blog post or website. This will make it more accessible and increase the likelihood of people sharing it.
Step 8: Check the Impact and Make Improvements
After you have shared your infographic, track its impact by analyzing the traffic and engagement it generates. Pay attention to the feedback and comments from your audience. If necessary, make improvements to your infographic to enhance its effectiveness.
In conclusion, creating an infographic requires careful planning, research, and design. By following the steps above, you can create visually appealing and informative infographics that will engage your audience and help drive traffic to your website.
Sources
When it comes to creating infographics, there are several concise and reliable sources that can help you turn data into visually appealing designs that engage and educate your audience. Below are some recommended sources to check out:
- Adioma: A website that offers simple and easy-to-use tools to create infographics. It allows you to select relevant icons, choose colors and fonts, and display your data in a visually appealing way.
- Wordy: A platform that helps you check the readability of your text by highlighting wordy phrases and suggesting concise alternatives. This tool can be useful when creating the content for your infographic to ensure that your message is clear and easy to understand.
- Video Infographics: Instead of using static images, you might consider creating video infographics. This can help increase engagement and drive more traffic to your website or social media channels. Video infographics combine storytelling and visual elements to deliver information and insights in a dynamic and compelling way.
When using these sources, it’s essential to keep your goal and brand in mind. Ensure that the designs you create align with your branding and communicate your message effectively. Additionally, always double-check your information to make sure it’s accurate and relevant before sharing it with your audience.