
If you are wondering how to create a flowchart in Microsoft Word, you have come to the right place. Flowcharts are a useful tool for visualizing processes, decision trees, and workflows. With the help of Microsoft Word, you can easily create flowcharts to document and illustrate various procedures.
To get started, first open Microsoft Word on your computer. Then, navigate to the “Insert” tab in the toolbar and click on the “Shapes” option. A drop-down menu will appear with a variety of shapes within different categories, including basic shapes, lines, and arrows.
You will find that Microsoft Word provides a good selection of shapes for creating flowcharts. However, if you would like more options and advanced features, there are other programs available, such as Microsoft Visio.
Once you have selected the desired shape, click and drag your mouse on the canvas to draw the shape. You can easily rearrange the shapes by clicking and dragging them to a different location on the page. To connect two shapes, simply hover your cursor over the first shape, click on the “Format” tab, and select the “Connectors” option.
In addition to basic shapes, Microsoft Word also provides a variety of formatting tools to enhance your flowchart. You can change the color of the shapes, add effects such as shadows or 3D effects, and even customize the line style and color.
To make your flowchart more visually appealing, you may want to consider using a different shape for key steps or decision points. This can help guide the reader’s eye and make the flowchart easier to understand.
One important thing to note when creating a flowchart in Microsoft Word is that it is best to start with a blank page or a blank worksheet. This allows you to have more control over the layout and design of your flowchart. You can also easily add additional pages if your flowchart becomes too large.
In conclusion, creating a flowchart in Microsoft Word is a simple process that can be done using built-in tools and features. Whether you are new to flowcharts or have some experience, Microsoft Word can help you create clear and professional-looking flowcharts to visualize your processes and workflows.
How to create flowcharts with Microsoft Word 2010 and 2013 Guide
If you’re looking to create flowcharts using Microsoft Word 2010 or 2013, this guide will show you how to easily do so. While there are more advanced programs like Visio available for flowcharting, Word is a basic program that most people already have as part of the Microsoft Office suite. Plus, if you’re using an alternative program like WPS or even a free program like Google Docs, the steps should be quite similar.
Before we explore the steps, it’s important to know that Word has a built-in feature for creating flowcharts, but it is not as specialized as other programs. However, it can still do the job if you only need a basic flowchart. Now, let’s dive into the process of creating a flowchart using Word.
Step 1: Open Microsoft Word and start a new document
First, open Microsoft Word and start a new document. You can choose a blank page or use a pre-built template if you prefer.
Step 2: Insert a canvas
Next, go to the “Insert” tab at the top of the Word window and click on “Shapes” in the “Illustrations” category. A drop-down menu will appear with various shapes to choose from. Scroll down and select the “Canvas” shape. This will provide a large blank space where you can draw your flowchart.
Step 3: Draw the flowchart symbols
Now, use the “Shapes” tools to draw the symbols you need for your flowchart. These symbols can represent different actions or decisions in your process. For example, you can use rectangles for process steps, diamonds for decision points, and arrows for the flow of the process. To draw a shape, click on the shape you want to use, then click and drag the mouse on the canvas to create the shape.
Step 4: Connect the shapes
To connect the shapes in your flowchart, use the “Line” tool under the “Shapes” tab. Click on the line option you prefer, then click and drag the mouse from one shape to another to connect them.
Step 5: Customize the flowchart
When you hover over a shape, a small blue circle with four arrows will appear. Click and drag this circle to move the shape around the canvas. You can also right-click on a shape to access additional options, such as changing the color or adding text. Use these tools to customize your flowchart as desired.
Step 6: Add text to the flowchart
To add text to a shape, simply double-click on the shape and start typing. You can also add a note to a shape by right-clicking on it and selecting “Add Text Note.” This note will appear as a small yellow sticky note attached to the shape.
Step 7: Rearrange the flowchart
If you need to rearrange the shapes in your flowchart, simply click and drag the shape to a new location on the canvas.
Step 8: Save or export the flowchart
Once you’re done creating the flowchart, save the document as you would normally do in Word. You can also copy and paste the flowchart into another program like PowerPoint or Excel if you need to use it elsewhere.
And there you have it! A step-by-step guide on how to create flowcharts with Microsoft Word 2010 and 2013. Now you can easily create basic flowcharts using the built-in tools available in Word’s program suite.
The Flowchart Drawing Canvas

When creating flowcharts in Microsoft Word, you will need to use the Flowchart Drawing Canvas. This canvas is like a blank page where you can draw and arrange your flowchart shapes and connect them to represent the flow of a process.
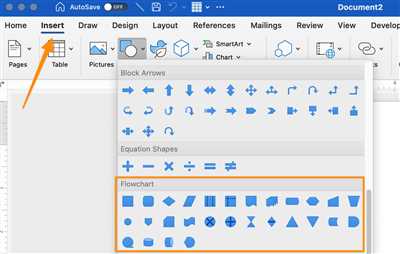
To access the Flowchart Drawing Canvas in Word 2013, you can go to the “Insert” tab and click on “Shapes” in the Illustrations group. From there, select the “Flowchart” category to see a variety of flowchart shapes that are available for you to use. You can also find alternative shapes and tools by exploring other categories within the Shapes suite.
Once you have selected a shape, like a basic rectangle, you can easily draw it on the canvas by clicking on the canvas and dragging your cursor to create the shape. To draw another shape, simply click and drag again.
To connect two shapes, click on the first shape and then on the small blue dots that appear on the sides or corners of the shape. Then, click on the blue dot of the second shape that you want to connect to, and a line will appear, indicating the connection. You can rearrange the shapes by clicking and dragging them around the canvas.
If you want to copy a shape, press and hold the “Ctrl” key while you click and drag the shape to a new position. You can also use the “Ctrl” key to select multiple shapes at once.
When you hover your cursor over a shape, a small “x” will appear in the top right corner. Clicking on this “x” will delete the shape from the canvas. If you want to delete multiple shapes at once, hold down the “Shift” key while clicking on each shape, and then press the “Delete” key.
In addition to basic shapes, Word also provides many built-in tools and effects that you can use to enhance your flowchart. For example, you can change the size and color of the shapes, add special effects, and more.
Knowing how to use the Flowchart Drawing Canvas in Word will be helpful in creating accurate and visually appealing flowcharts. It provides an easy-to-use interface for drawing and connecting shapes, and allows you to explore various options within the program.
Part 2 How to Create a Flowchart in Excel Microsoft WPS
In the previous part of this guide, we discussed how to create a flowchart in Microsoft Word. In this part, we will explore another option for creating flowcharts, which is using Microsoft Excel or WPS Office Spreadsheet. These programs are part of the Microsoft Office Suite and provide alternative tools for flowcharting.
Step 1: Open Microsoft Excel or WPS Office Spreadsheet and create a blank page. This will be the canvas where you will draw the flowchart.
Step 2: Click on the “Insert” tab at the top of the screen. Within the “Insert” tab, you will find various categories of tools. Look for the “Shapes” category and click on it. A drop-down menu will appear with different shapes that you can use for your flowchart.
Step 3: Select the shape that you want to use for your flowchart, such as a rectangle, circle, or diamond. With your cursor, click and drag on the blank canvas to draw the shape. You can easily customize the size and appearance of the shape using the options available in the program.
Step 4: To connect the shapes and create the flow of the chart, select the “Line” tool from the “Shapes” category. Click and drag from one shape to another to draw the connecting line. You can also add special effects to the lines, such as arrows or dotted lines, to further enhance your flowchart.
Note: WPS Office Spreadsheet is an alternative program that you can use if you don’t have access to Microsoft Excel. The steps for creating a flowchart in WPS are similar to the ones outlined above for Excel.
Step 5: When you are finished drawing the flowchart, you can add text to the shapes to explain each step. Simply double-click on a shape and type the text. You can also customize the font, size, and color of the text using the options available in the program.
Step 6: To make your flowchart more visually appealing, you can add color and formatting to the shapes and lines. This can help highlight important points or different categories within the flowchart.
Step 7: If you need to move or resize any of the shapes or lines, you can easily do so by clicking and dragging them with your mouse. This allows you to rearrange the flowchart as needed.
Step 8: Once your flowchart is complete, you can save it and use it as a visual guide or share it with others. You can also copy and paste the flowchart into other programs such as Microsoft Word or PowerPoint.
That’s it! You have now learned how to create a flowchart in Microsoft Excel or WPS Office Spreadsheet. These programs provide a flexible and powerful alternative to Microsoft Word for flowcharting. Please note that this is just a basic guide and there are many more advanced features and techniques that you can explore within these programs to create even more complex and detailed flowcharts.
21How to Create a Flowchart in Microsoft Excel
If you need to create a flowchart, Microsoft Excel is a great program to use. It is a versatile tool that allows you to create professional-looking flowcharts with ease. In this guide, we will show you how to create a flowchart in Microsoft Excel 2010 or later.
Before we dive into the steps, please note that this guide assumes that you have basic knowledge of Microsoft Excel. If you are new to the program, it might be helpful to explore some tutorials or guides to familiarize yourself with the interface and basic functions.
Now, let’s follow these steps to create a flowchart in Microsoft Excel:
- First, open a new Excel worksheet. This will serve as the canvas for your flowchart.
- Next, click on the “Insert” tab at the top of the screen.
- In the “Illustrations” category, click on the “Shapes” option. A dropdown menu will appear with various shapes you can use in your flowchart.
- Select the shape that represents the first step or process in your flowchart. For example, you can choose a rectangle shape.
- Move your mouse to the worksheet, and you’ll notice that it changes into a crosshair.
- Click and drag the mouse within the worksheet to draw the shape. The shape will appear on the canvas.
- If you want to add more shapes to your flowchart, repeat steps 4 to 6.
- To connect the shapes together, click on the shape from which you want to draw a connecting line.
- Move your mouse to the yellow diamond-shaped indicator that appears on the shape.
- Click and drag the mouse to the shape to which you want to connect. This will create a line between the shapes.
- If you want to customize the appearance of the shapes or lines, you can do so by right-clicking on a shape or line and selecting the desired option from the menu.
- You can also copy and paste shapes to repeat them or move them around within the flowchart.
- If you need to add text to a shape, double-click on the shape and type the desired text.
- If you make a mistake or want to change the order of the shapes, you can delete or move them by selecting the shape and using the appropriate option from the menu.
- When you are satisfied with your flowchart, you can save it by clicking on the “File” tab, selecting “Save As,” and choosing a location to save the file.
That’s it! By following these simple steps, you can create a flowchart in Microsoft Excel. Please note that there are also other programs available, such as Microsoft Word, PowerPoint, and Visio, that have built-in tools for creating flowcharts. If you want to learn more about flowcharting or explore further options, consider referring to their respective guides or online resources.
22How to Create a Flowchart in WPS Excel
If you’re looking to create a flowchart in WPS Excel, you’re in luck! With WPS Office, you can easily create professional-looking flowcharts to visualize your processes and procedures. In this guide, we will show you step-by-step how to create a flowchart using WPS Excel.
1. Open WPS Excel: To begin, open WPS Excel on your computer. If you don’t have WPS Office installed, you can download and install it from the official website.
2. Create a New Worksheet: Once you have WPS Excel open, click on “Blank Workbook” to create a new worksheet.
3. Access the Flowcharting Tools: To access the flowcharting tools in WPS Excel, click on the “Insert” tab in the top menu bar. Then, click on the “Shapes” button in the “Illustrations” category.
4. Explore the Available Shapes: WPS Excel offers a wide variety of shapes that you can use to create your flowchart. Some of the available shapes include basic shapes like rectangles and circles, as well as more specialized shapes like arrows and decision diamonds. To see all the available shapes, click on the “More” button in the Shapes gallery.
5. Draw and Customize Shapes:
– To draw a shape, simply click on the desired shape from the shapes gallery, and then click and drag on the worksheet to draw the shape.
– To customize the shape, right-click on it and select “Format Shape” from the context menu. From here, you can change the fill color, line color, and other effects of the shape.
6. Connect the Shapes: To connect two shapes together, click on the first shape, and then click on the “Connector” tool in the “Lines” category. Then, click on the second shape, and a blue line with connection points will appear. Click on the connection points to connect the shapes.
7. Add Text and Labels: To add text to a shape, simply double-click on it and start typing. You can also add labels by clicking on the “Text Box” button in the “Illustrations” category and then clicking on the worksheet to place the text box.
8. Save and Share Your Flowchart: When your flowchart is complete, you can save it by clicking on the “File” tab and selecting “Save As”. Choose a location on your computer to save the file, give it a name, and click “Save”. You can also share the flowchart by exporting it to a PDF or image file format.
And there you have it! By following these steps, you can easily create a flowchart in WPS Excel. It’s a good alternative to Microsoft Visio or other flowcharting programs, and it’s within the WPS Office suite which offers a variety of other tools and programs as well.
Learn PowerPoint
PowerPoint is a powerful program that allows you to create visually appealing presentations, including flowcharts. With its user-friendly interface and various built-in tools, PowerPoint is a great option for creating flowcharts.
To start creating a flowchart in PowerPoint, open the program and click on the “Blank Presentation” option. This will open a blank canvas for you to begin your flowchart.
Once the blank canvas is open, you can start drawing the shapes and lines that make up your flowchart. PowerPoint provides a variety of shapes that you can use, such as rectangles, ovals, and arrows. To draw a shape, click on the “Insert” tab, then click on the “Shapes” option. A drop-down menu will appear with various categories of shapes. Selecting a shape from one of the categories will allow you to draw it on the canvas.
When drawing your flowchart, you will want to use lines to connect the shapes and show the flow of the process. To draw a line, click on the “Insert” tab, then click on the “Shapes” option. Hover your cursor over the “Lines” category, and options for different types of lines will appear. Click on the type of line you want to use, then click and drag on the canvas to draw the line.
You can rearrange the shapes and lines of your flowchart by clicking and dragging them around the canvas. You can also resize the shapes by clicking and dragging their corners. If you want to copy and paste shapes, simply right-click on the shape and select the “Copy” option, then right-click on the canvas and select the “Paste” option.
In addition to basic drawing tools, PowerPoint also provides special effects and formatting options that can enhance your flowchart. For example, you can add a shadow or a 3D effect to a shape to make it stand out. You can also apply different color schemes and font styles to make your flowchart visually appealing.
If you are familiar with other programs like Microsoft Word, Excel, or Visio, you will find that PowerPoint works in a similar way. It has many of the same drawing tools and formatting options, making it easy to create flowcharts that match the style of other documents.
In summary, PowerPoint is a versatile program that allows you to create flowcharts with ease. Whether you are a beginner or an experienced user, PowerPoint has the tools and features to help you create professional-looking flowcharts.
Note: If you don’t have PowerPoint, you can also use alternative programs like Word or Excel, which have their own drawing tools and can be used to create flowcharts. WPS Office Suite is one such program that offers a good selection of drawing tools and the ability to create flowcharts within a word or worksheet.
Sources

When it comes to creating flowcharts in Microsoft Word, there are several sources you can explore to further understand this process. Here are some options:
| Microsoft Word: | Word offers built-in tools that allow you to create flowcharts. You can find these tools in the “Insert” tab, under the “Shapes” category. This is a basic option that is also available in other Microsoft Office programs. |
| Visio: | If you need more advanced features and effects for your flowchart, Visio is a great tool to consider. It is a part of the Microsoft Office suite and allows you to create flowcharts with a variety of customization options. |
| WPS Office: | WPS Office is an alternative office suite that includes a program called WPS Writer. This program is similar to Microsoft Word and has flowcharting tools built in. |
| Online tools: | If you don’t have access to Microsoft Office or prefer to work online, there are various online tools available for creating flowcharts. Some examples include Draw.io, Lucidchart, and SmartDraw. |
These sources will provide you with the necessary tools and guidance to create flowcharts in Microsoft Word. You can use the steps outlined in this guide to help you create flowcharts in Word and customize them to fit your needs.